
Figure 5.
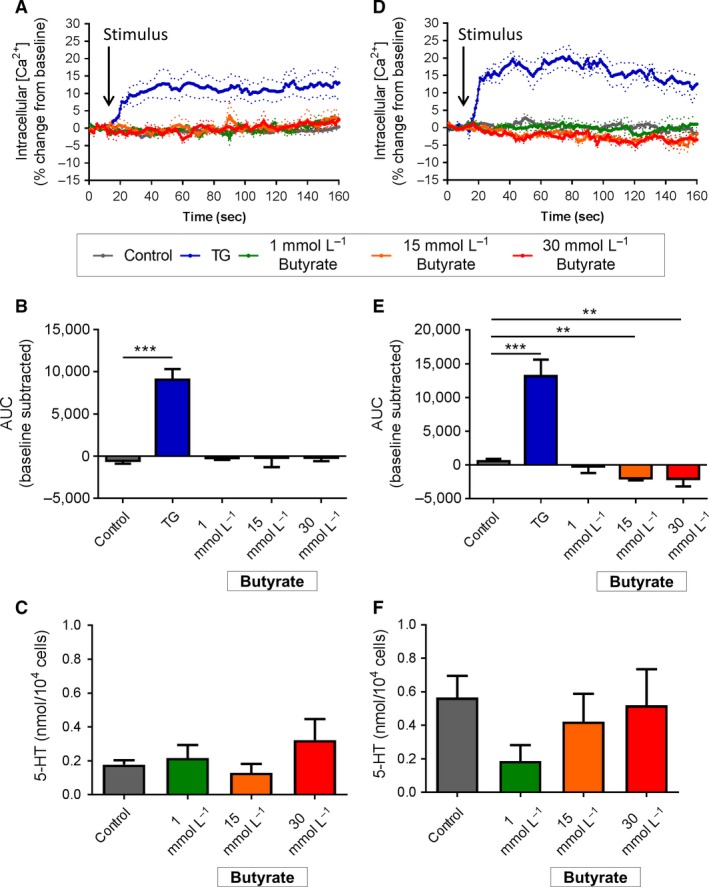
Effect of butyrate stimulation on duodenal and colonic EC cells. (A) Time course of Ca2+ (i) changes in duodenal EC cells in response to butyrate, shown as % change from baseline. Dotted lines indicate SEM. Arrow indicates time of stimulus addition (n = 4–5 mice). (B) AUC of Ca2+ (i) in duodenal EC cells. ***P < 0.001 (n = 4–5 mice). (C) Release of 5‐HT from duodenal EC cells in culture following 2 h exposure to butyrate (But) or α‐MG (n = 5 mice). (D) Time course of Ca2+ (i) changes in colonic EC cells in response to butyrate, shown as % change from baseline. Arrow indicates time of stimulus addition (n = 3–4 mice). (E) AUC of Ca2+ (i) in colonic EC cells. **P < 0.01 (n = 3–4 mice). (F) Release of 5‐HT from colonic EC cells in culture following 2 h exposure to butyrate. (n = 5–7 mice). Data are shown as mean ± SEM. AUC, area under the curve