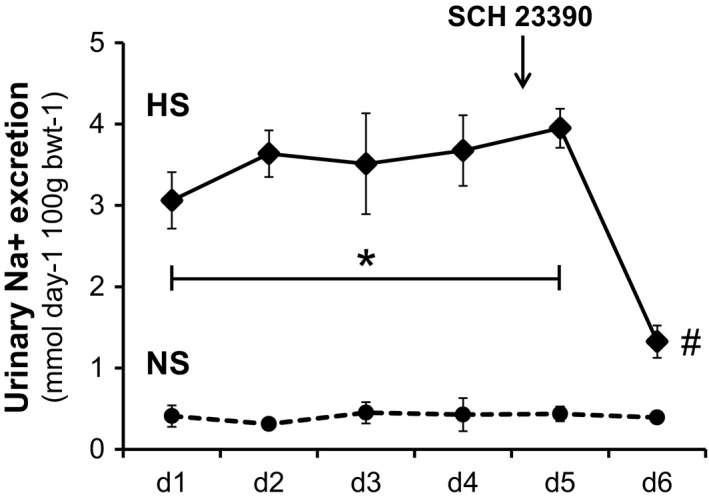
Figure 1.

The different dynamic profile of urinary sodium excretion (mmol/day/100 g bwt) between normal salt (NS, dashed line) and high salt (HS, continuous line) groups before and after treatment with the D1‐like receptor antagonist SCH 23390. Horizontal axis shows days of urine collection as d1 to d6. Results are expressed as the mean ± SEM, n = 7 rats per group. ANOVA for repeated measures. Symbols denote *P < 0.001 HS versus NS and #P < 0.001 HS post SCH23,390 versus HS.
