Figure 4.

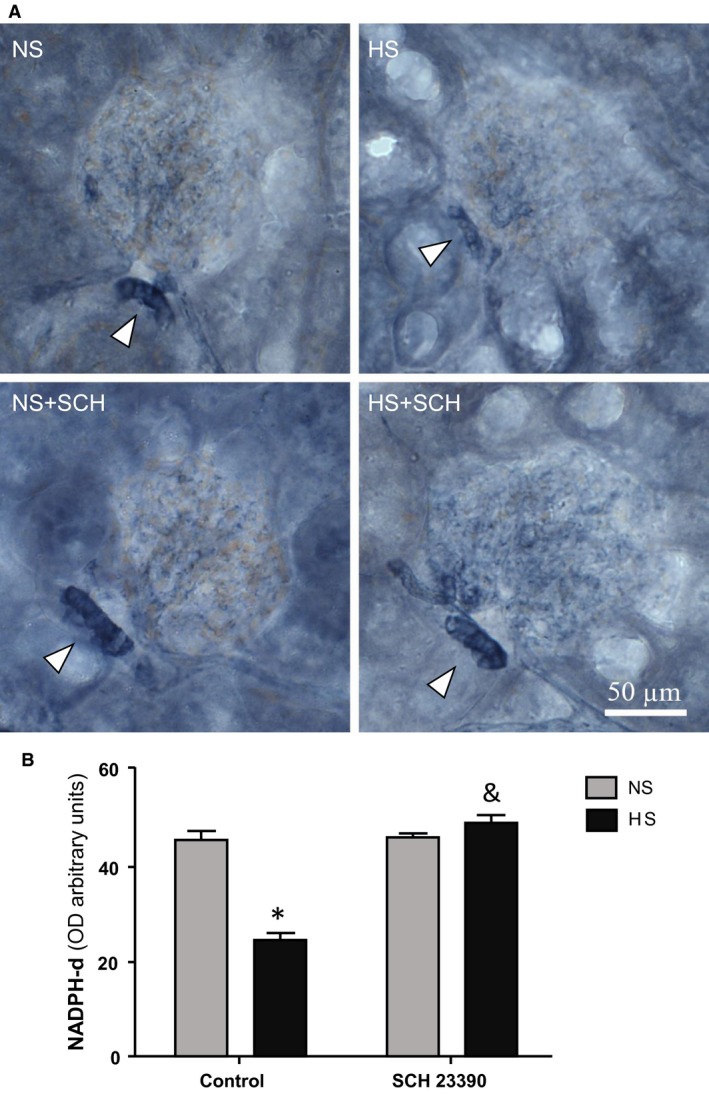
NADPH diaphorase (NADPH‐d) staining in renal cortical tissue. (A) Representative images of NADPH‐d staining. NS: control rats receiving a normal salt diet that were not treated with D1‐like receptor antagonist SCH 23390; HS: control rats receiving a high salt diet that were not treated with D1‐like receptor antagonist SCH 23390; NS+SCH: rats receiving a normal salt diet and treated with D1‐like receptor antagonist SCH 23390; HS+SCH: rats receiving a high salt diet and treated with D1‐like receptor antagonist SCH 23390. Arrowheads point to macula densa staining. (B) NADPH‐d optical density analysis. Two way ANOVA showed a statistically significant interaction (P < 0.001) between the effects of high salt intake and SCH 23,390 treatment. * P < 0.001 versus NS; & P < 0.001 versus HS. Results are expressed as mean ± SEM; (n = 5).
