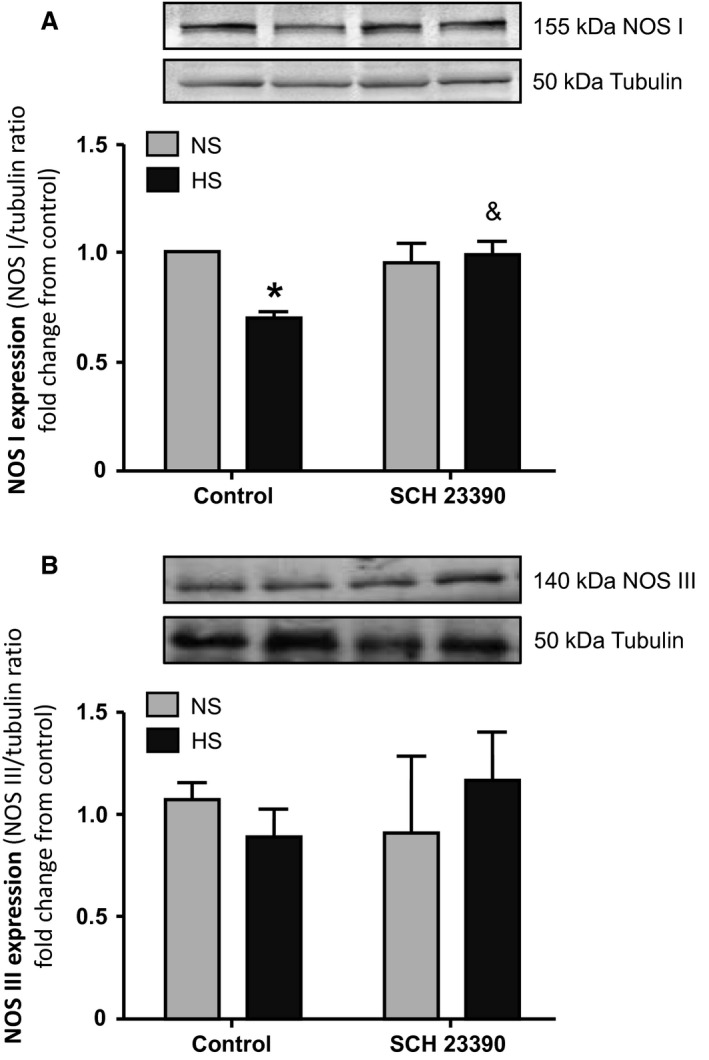
Figure 5.

(A) NOS I expression and (B) NOS III expression in homogenates of renal cortex. NS: normal sodium intake; HS: high sodium intake; control: rats not treated with the D1‐like receptor antagonist SCH 23390; SCH 23390: rats treated with the D1‐like receptor antagonist. (A) Top panel: representative western blot of NOS I (155 kDa band) and tubulin (50 kDa band) in renal cortex. Bottom bars: NOS I expression indicated as NOS I/tubulin ratio fold change from NS control rats. (B) Top panel: representative western blot of NOS III (140 kDa band) and tubulin (50 kDa band) in renal cortex. Bottom bars: NOS III expression indicated as NOS III/tubulin ratio fold change from NS control rats. (A) Two‐way ANOVA showed a statistically significant interaction (P < 0.05) between the effects of high salt intake and SCH 23390 treatment on NOS I expression. * P < 0.01 control HS rats versus control NS rats; & P < 0.05 HS+SCH versus HS. Results are expressed as mean ± SEM (n = 5). (B) Two‐way ANOVA did not show statistical differences in NOS III expression. Results are expressed as mean ± SEM (n = 5).
