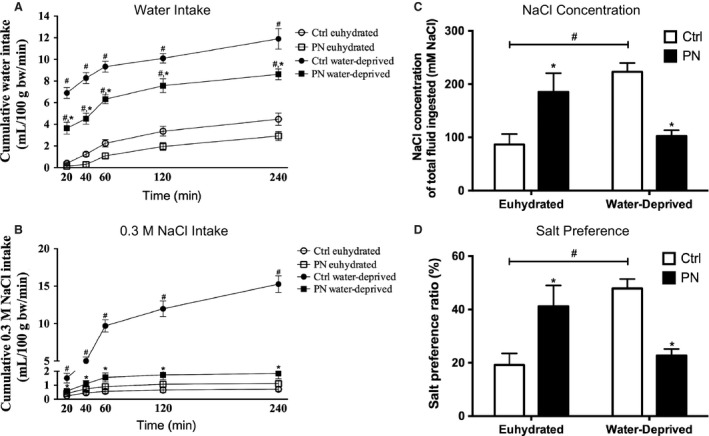
Figure 5.

Cumulative water (A) and 0.3 mol/L NaCl (B) intakes in Ctrl and PN male adult offspring subject or not to 48‐h water deprivation. (C) Sodium chloride concentration of total fluid (mmol/L NaCl) and (D) salt preference (Argüelles et al. 1996). Open circle: Ctrl euhydrated; open square: PN euhydrated; filled circle: Ctrl water‐deprived; filled square: PN water‐deprived. Results are presented as mean ± SEM. *P < 0.05 versus Ctrl euhydrated or water‐deprived and # P < 0.05 versus euhydrated groups. N = 6–10.
