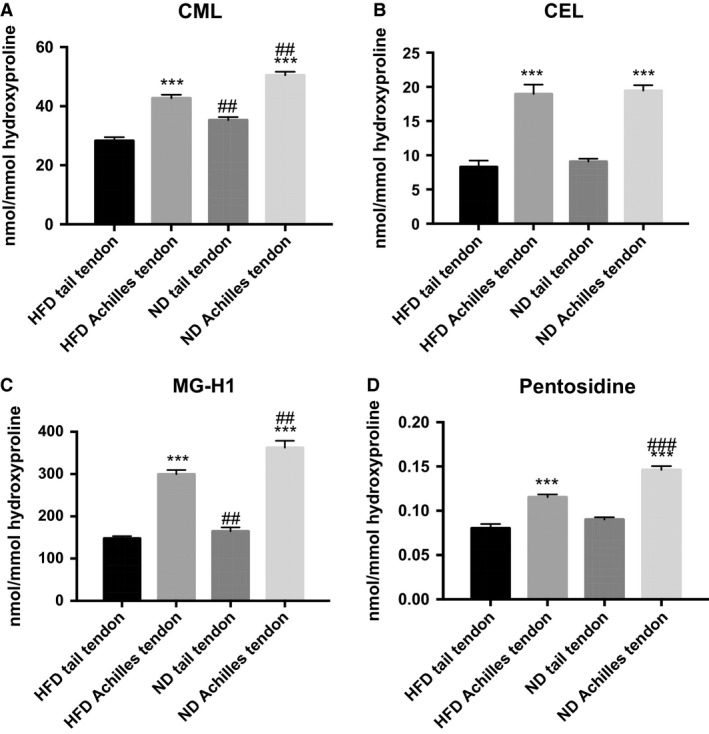
Figure 1.

Advanced glycation endproduct content in tail tendon and Achilles tendon. Data given as Mean ± SEM, Fat: n = 11, Chow: n = 14, (A): CML: ***diff from tail P < 0.0001 (main effect), ##diff from HFD P < 0.001 (main effect). (B): CEL: ***diff from tail P < 0.0001 (main effect) (C): MG‐H1: ***diff from tail P < 0.0001 (main effect), ## diff from HFD P < 0.001 (main effect). (D) Pentosidine: There was an interaction (P < 0.01), which showed an increase in pentosidine for the ND group in the Achilles (### diff from HFD P < 0.0001), but not in the tail tendon (P = 0.27). For both diets there was an effect of tissue (***diff from tail P < 0.0001). HFD, high‐fat diet.
