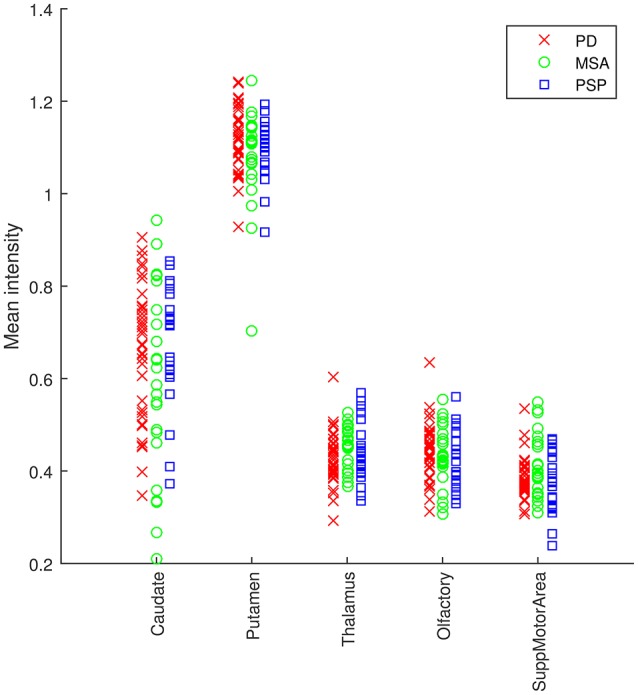
Figure 3.

Analysis of the average intensity of the five regions of interest found in the analysis of DMFP data. Each patient is represented by five values: the average intensity of his DMFP neuroimage on the caudate, putamen, thalamus, olfactory, and supplementary motor area. The values of each region are grouped by the patient group: PD (red crosses), MSA (green circles), and PSP (blue squares).
