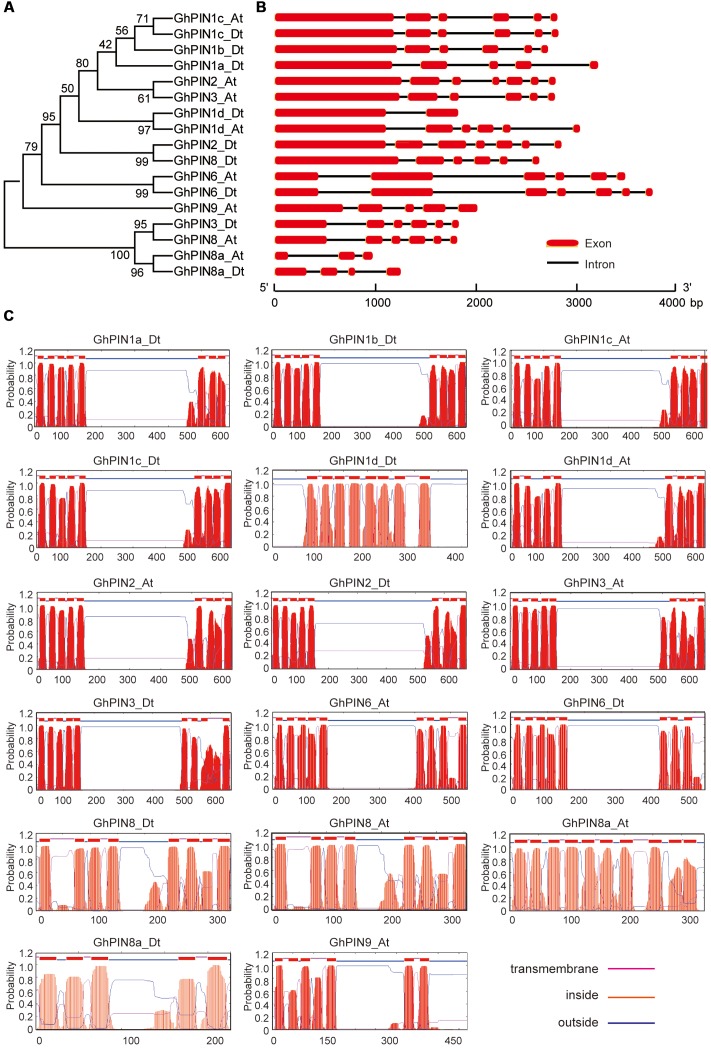
FIGURE 3.
Phylogenetic relationships, gene structures, and transmembrane topology prediction for the GhPINs. (A) Phylogeny of 17 PIN proteins in Gossypium hirsutum. The phylogenetic tree (left panel) was constructed in MEGA 5.0 using the neighbor-joining (NJ) method with 1000 bootstrap replicates. (B) The gene structures (right panel) were drawn with the Gene Structure Display Server 2.042. The exons and introns are marked with red boxes and black lines, respectively. The scale bar is shown at the bottom. (C) Transmembrane topology prediction of the GhPIN proteins. The transmembrane helices of the GhPIN proteins were predicted using the TMHMM Server v.2.0 (http://www.cbs.dtu.dk/services/TMHMM/). The red peaks indicate the predicted transmembrane helices.

