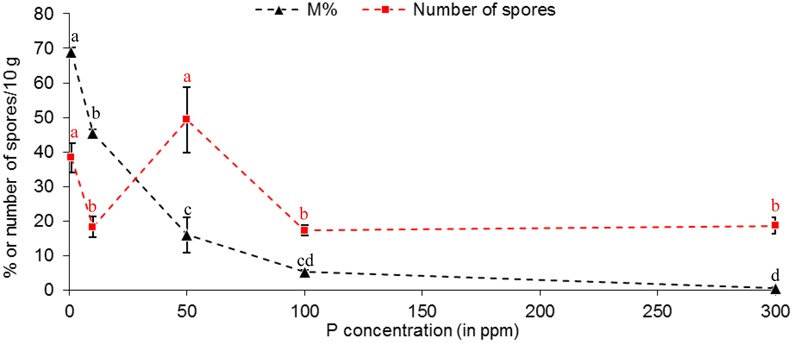
FIGURE 5.

Effect of phosphorus concentrations in non-treated plants on mycorrhizal sporulation, compared to mycorrhizal development in root. R. irregulare spore number in 10 g of substrate and intensity of mycorrhiza in root (M%, added only to visualize the differences with sporulation profile) at 8WAI through phosphorus concentration after inoculation of potato in vitro plantlets. Data show means (n = 3) ± SE. Treatments with the same letter are not significantly different (P < 0.05, Duncan’s multiple range tests ANOVA). Statistical tests were performed separately for each fungal parameter, and after arcsin transformation of percentage values (M %). Data analysis was performed with the SAS enterprise guide 4.1 (SAS Institute Inc., Cary, NC, USA).
