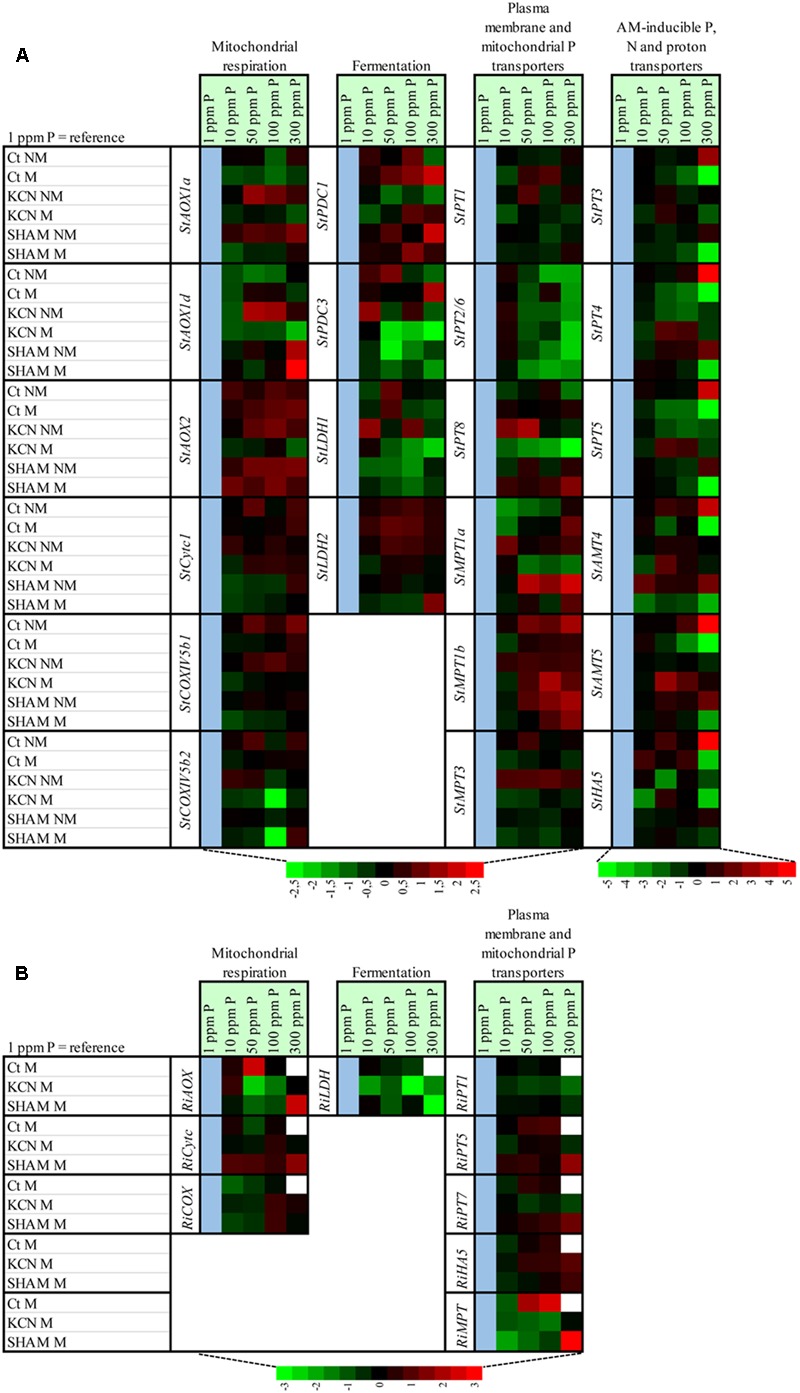
FIGURE 9.

Heat map showing the effect of P concentration on the relative expression of genes involved in mitochondrial respiratory chain, fermentation, phosphorus, nitrogen and proton plasma membrane transporters and mitochondrial phosphorus transporters in potato root and in R. irregulare, following inoculation or not of AMF, treatment or not with two respiratory inhibitors through two phosphorus concentrations. The heat map shows the real-time quantitative RT-PCR (qRT-PCR) analysis results of genes involved in mitochondrial respiratory chain (three StAOX isoforms, StCytc1, StCOXVb1, StCOXVb2, RiAOX, RiCytc, and RiCOXIVb), fermentation (two StPDC and two StLDH isoforms and RiLDH), phosphorus, nitrogen and proton plasma membrane transporters (six StPT isoforms, two StAMT isoforms, StHA1, three RiPT isoforms and RiHA5) and mitochondrial phosphorus transporters (three StMPT isoforms and RiMPT) in potato root (A) and in R. irregulare (B), under five phosphorus concentrations and following treatment by KCN (at 7 DAI – 0.1 mM) or SHAM (at 7 DAI – 0.1 mM) or not treated (Ct). Plants were inoculated (M) or not (NM) by R. irregulare. The expression levels of genes are presented using fold-change values transformed to Log2 format compared to 1 ppm P as reference (cell in blue). White cells correspond to non-determined analyses. The Log2 (fold-change values) and the color scale are shown at the bottom of heat map.
