FIGURE 4.

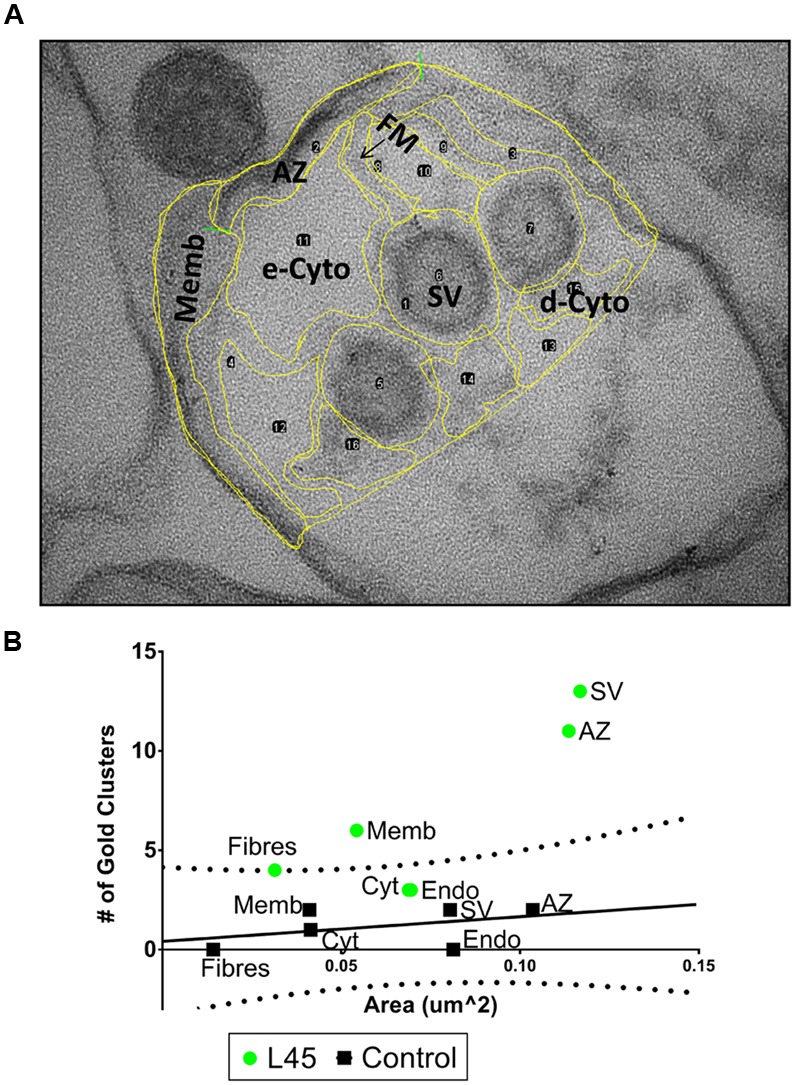
Compartment analysis of immunogold labeling in L45-cryoloaded ghosts. (A) An example of regional compartments identified by structural markers in a synaptosome ghost section including: AZ, active zone membrane; Memb, non-AZ plasma membrane; FM, filaments running from the AZ; SV, synaptic vesicles; e-Cyto, cytoplasm devoid of electron-dense structures; d-Cyto, cytoplasm with electron-dense structures. Endo, endosomes and unidentifiable membrane-enclosed organelles were not present in this image but were present in other ghosts examples. The same image as in Figure 3A but with a lower contrast to view yellow border line overlay. (B) For each ghost, we counted the number of nanogold clusters and measured the total area of each compartment. Then, for each treatment, the total number of nanogold clusters and the total area of each compartment were pooled. These values were then displayed as a scatter plot. In controls (black squares) the number of nanogold clusters increased approximately linearly with net compartment area, consistent with random labeling. The control data was fit with a regression line (black line) together with its 95% prediction bands (dotted lines). The L45 experimental data were plotted on the same axes (green circles). e-Cyto data were omitted from the plot (see text). n = 12 ghosts from 3 separate IgG and L45 immunolabeling experiments.
