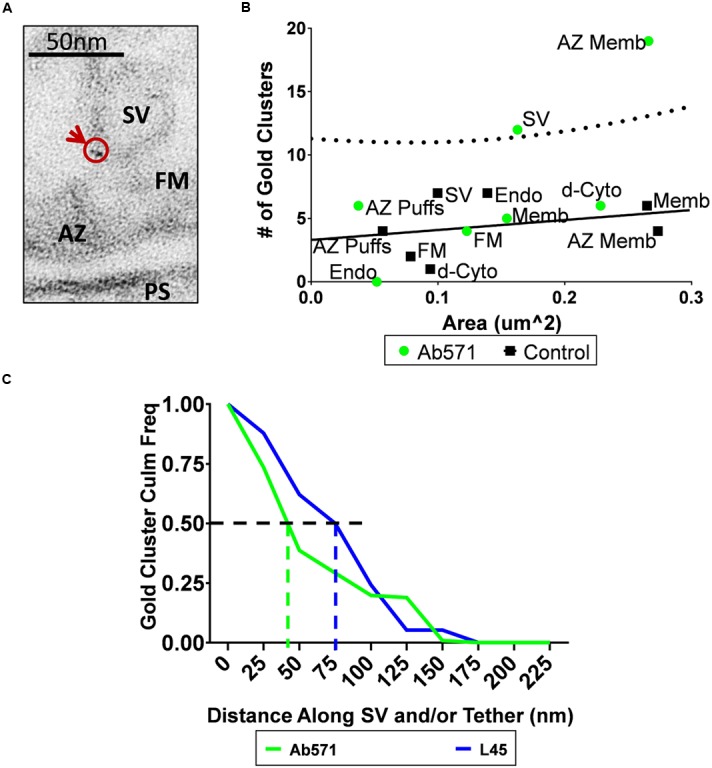
FIGURE 6.

Immunogold localization of the CaV2.2 channel by an antibody against its II–III loop. (A) Immunostain with Ab571 showing a nanogold cluster associated with an SV located close ( ≤ 65 nm) to the active zone. (B) Compartment analysis of Ab571 immunogold labeled ghosts, as in Figures 4A,B. Dotted line denotes the 95% prediction limit for a regression fit to the control IgG data (n = 19; black squares) with the Ab571 data overlain (n = 19; green circles). (C) Inverse cumulative frequency histogram of the distance of each gold cluster from the surface membrane traced along the tether for individual SVs. Data was compensated for non-specific labeling as measured with respective IgG controls and normalized to the number of ghosts analyzed (Ab571, n = 19; L45, n = 12). The color-coded vertical dashed lines identify the distance for 50% of the nanogold cluster frequency for each condition.
