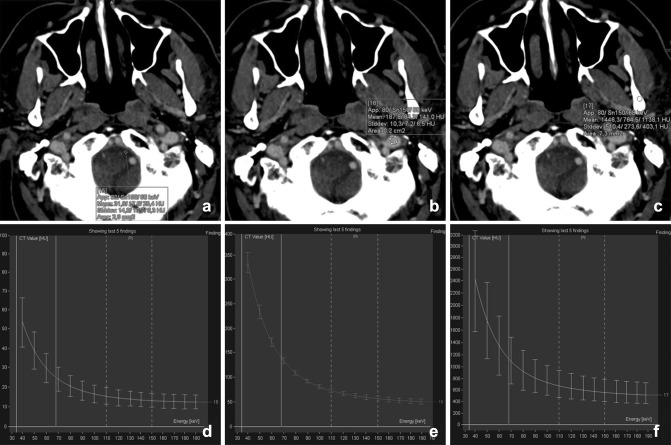
Fig. 1.
The spectral curves depicted from a DECT of the neck are shown for cerebrospinal fluid (water a, d), vessels (iodine b, e), and bone (calcium c, f). Hounsfield units (HU) are plotted against the mono-energetic energies ranging from 30 to 190 keV. Note that the HU scale differs for each plot. At lower energy, the HU increases, especially in calcium and iodine

