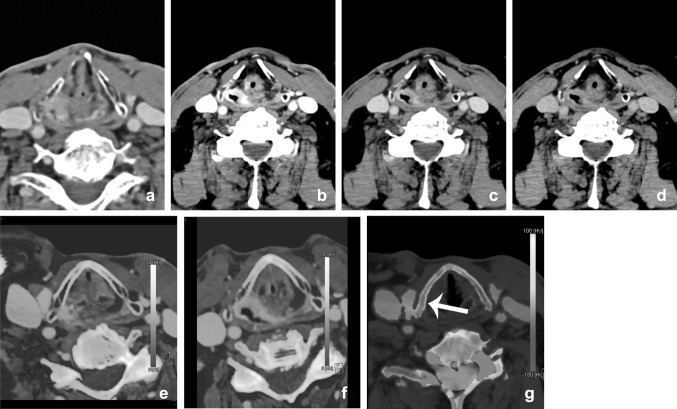
Fig. 10.
Different reconstructions from one dataset. DECT of a 77-year-old male showed a right-sided piriform sinus SCC (a, mixed), suggestive of thyroid invasion. The tumor delineation is better depicted at the lower-energy images of the VMI (b: 40 keV; c: 70 keV; and d: 100 keV), and on the iodine fusion images (e, f). Bone marrow edema (BME) image (d), which demonstrates edema at the thyroid cartilage. Visualization of direct tumor invasion is the easiest way to demonstrate cartilage invasion; this can be demonstrated made more easily by means of lower-energy images from VMI and iodine fusion images. Demonstration of edema of the thyroid in virtual non-calcium images can serve as an additional argument for invasion of the thyroid (arrow)

