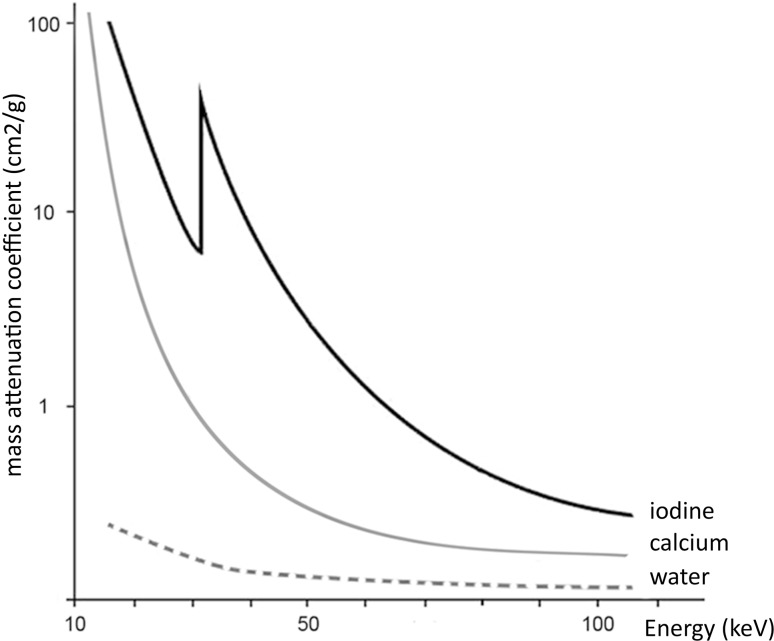
Fig. 2.
Attenuation curves of iodine, calcium, and water plotted against energy (keV). At lower energy, the attenuation of iodine (Z = 53) is increasing with an additional increase at the k-edge. The attenuations of calcium (Z = 20) and water are significantly lower than that for iodine, providing the possibility for material differentiation in DECT

