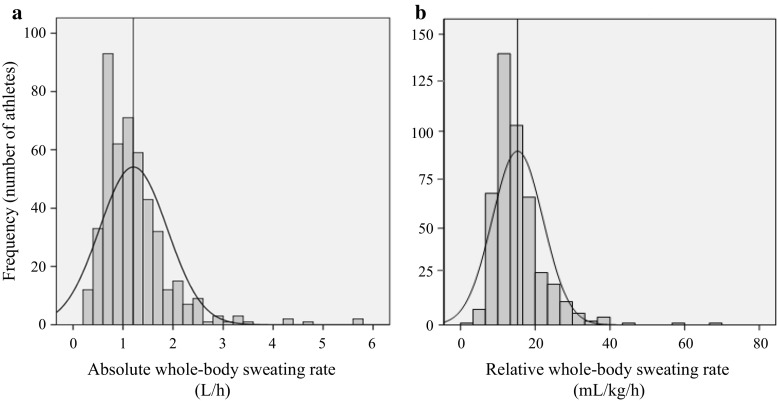
Fig. 1.
Frequency histograms of (a) absolute whole-body sweating rate and (b) relative whole-body sweating rate from 461 athletes (327 adults, 134 youth; 369 male, 92 female) of various sports (e.g. American Football, basketball, baseball, soccer, tennis, and endurance) tested during training or competition in various environmental conditions (15–50 °C, 20–79% relative humidity). The vertical line represents the mean value. Reproduced from Baker et al. [96], with permission

