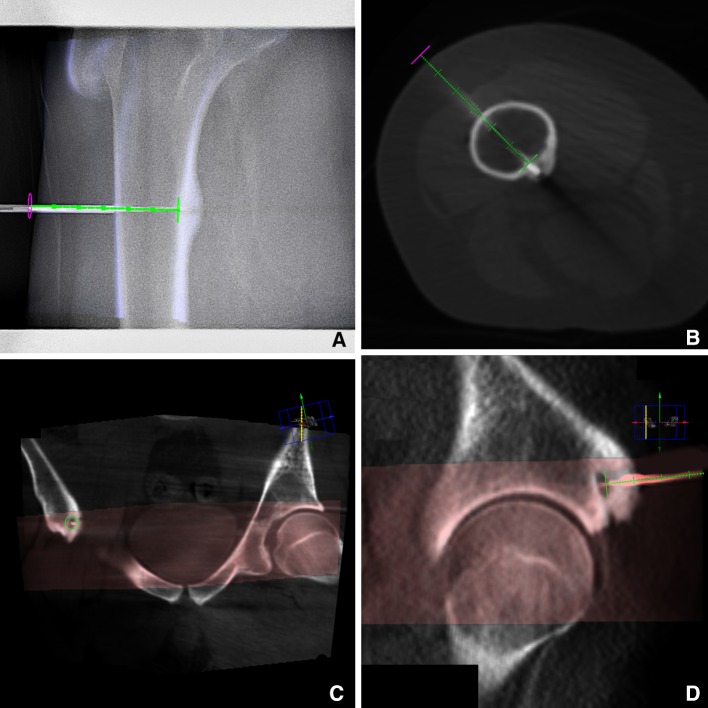
Fig. 1.
CBCT images of 2 patients with osteoid osteoma. A shows the overlay during fluoroscopy guidance in the progress view. B shows a CBCT scan of the same patient, with the RF electrode along the planned needle path (green). In C and D, the CBCT scan is fused with a previous CT scan, the CT scan is visualized in gray and the CBCT scan in red. In C, the entry point view is visualized and D shows the progress view

