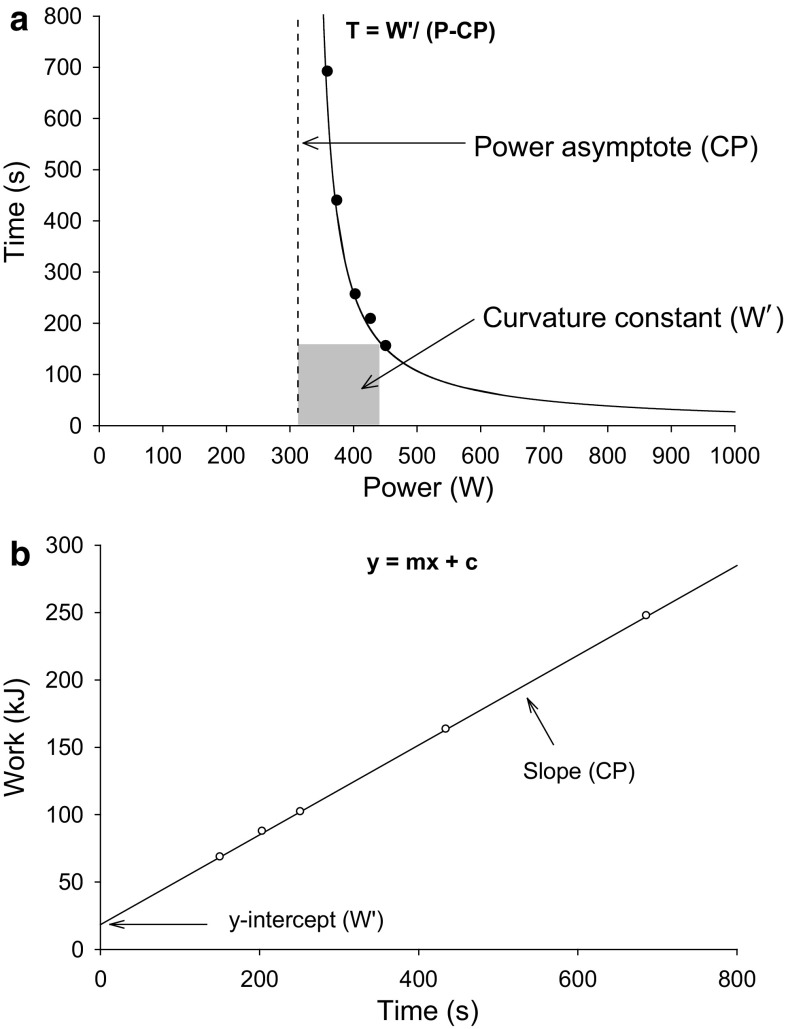
Fig. 1.
a Hyperbolic relationship between power output (x-axis) and time (y-axis), where the critical power is indicated by the power-asymptote and the W′ is the curvature constant; b linearized two-parameter critical power model where total work done is plotted against time. In this permutation, the critical power is given by the slope of the regression and the W′ is the y-intercept. CP critical power, P power, T time, W′ curvature constant of power–time relationship

