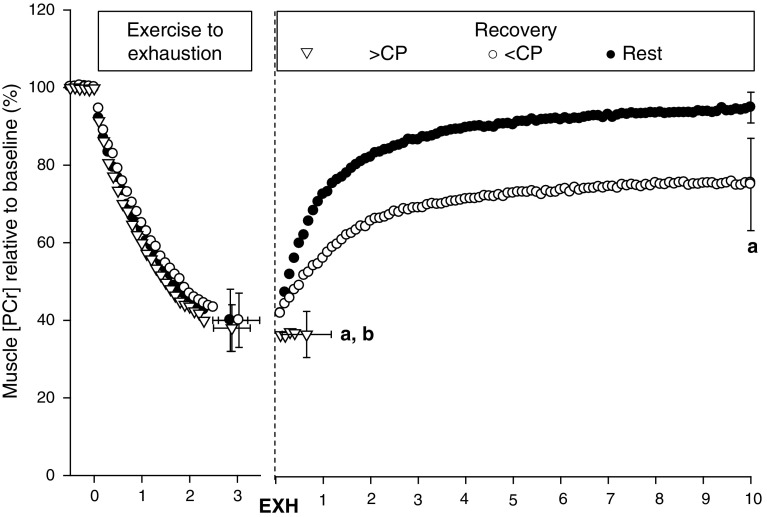
Fig. 3.
Muscle phosphocreatine responses to constant power output severe-intensity exercise immediately followed by passive recovery (black circles), exercise <CP (white circles) or exercise >CP (white triangles). a End-recovery muscle [PCr] was lower in >CP and <CP recovery conditions compared with rest (p < 0.05). b End-recovery muscle [PCr] was significantly lower for >CP condition compared with rest and <CP recovery (p < 0.05). Figure has been re-drawn based on data from Chidnok et al. [44]. CP critical power, EXH exhaustion, [Pcr] phosphocreatine concentration

