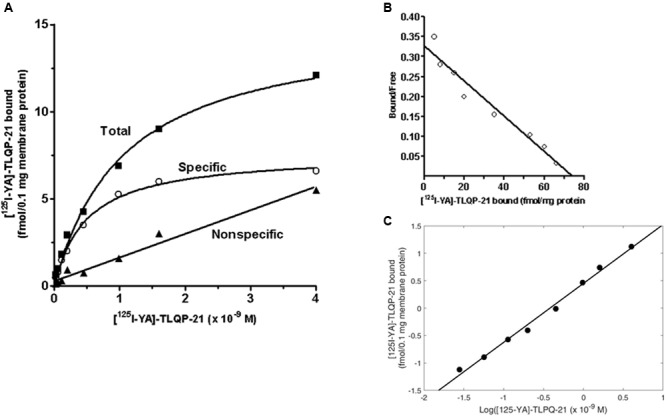
FIGURE 4.

Representative saturation isotherms, Scatchard and Hill plot of [125I]-YATL-23 binding to CHO cell membranes. (A) Experiments were performed by incubating a fixed amount of membrane proteins with increasing concentrations of radiolabelled YATL-23, either alone (total binding) or together 1 μM unlabelled YATL-23 (nonspecific binding), respectively. Specific binding values were obtained subtracting nonspecific binding from total binding. (B) The saturation curve of specific binding was analyzed by Scatchard analysis. Values of Kd = 0.55 ± 0.05 × 10⁻⁹ M and Bmax = 81.7 ± 3.9 fmol/mg protein were calculated using data obtained in three independent experiments. (C) Hill plot of the same data. The calculated Hill slope of 1.07 ± 0.1 is indicative of a single class of binding sites.
