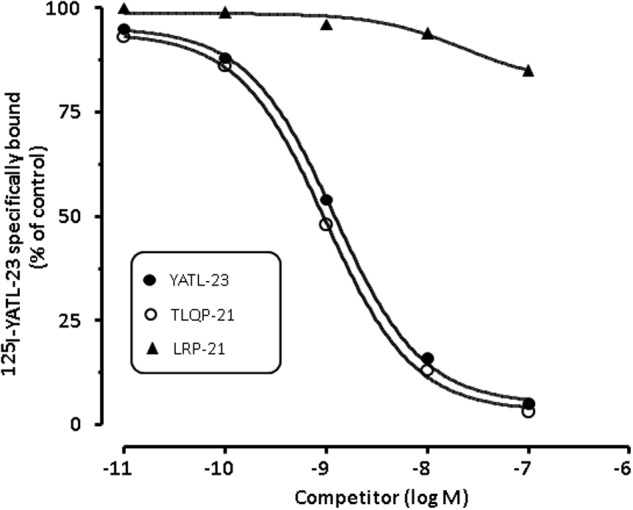
FIGURE 5.

Representative competition binding curves for [125I]-YATL-23 to CHO cell membranes by the indicated competitors. Binding is expressed as percentage of control (specific binding in the absence of unlabelled competitor). Values are the means ± SEM of measurements obtained in six different wells for each experiment.
