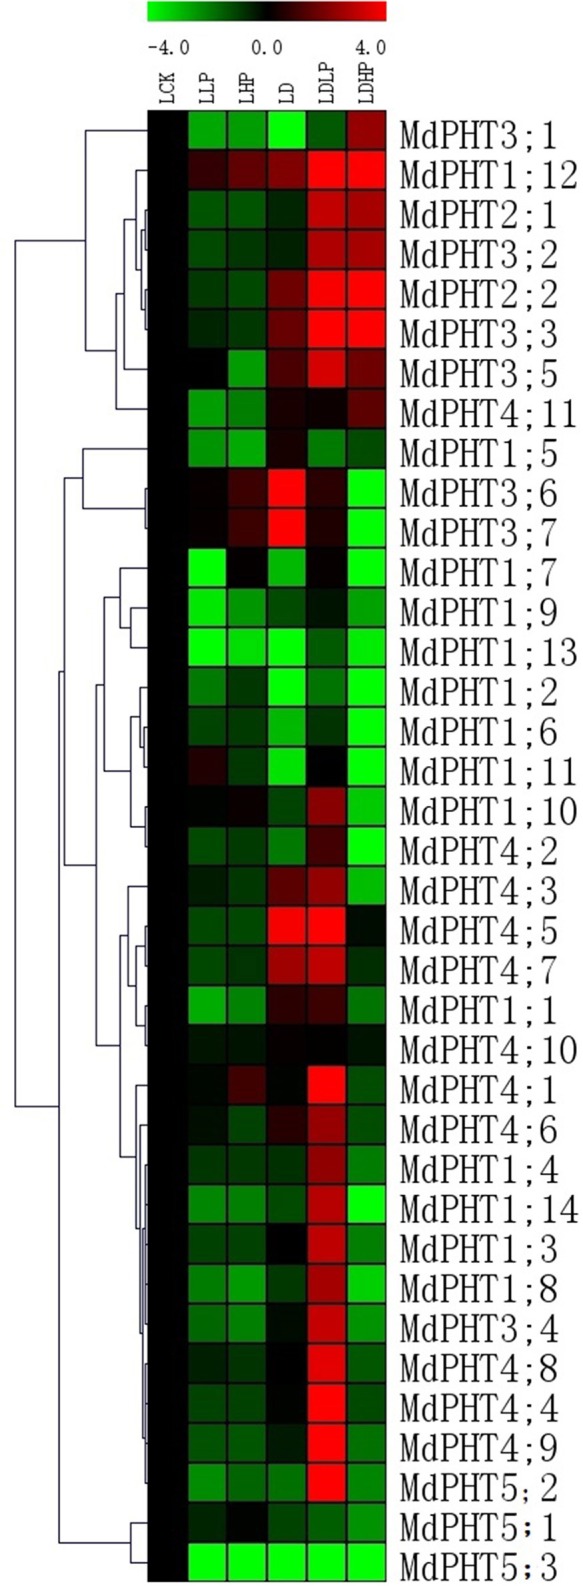
Figure 6.

The expression profiles of PHT genes in leaves of Malus hupehensis var. pingyiensis. Heatmap shows PHT gene expression across after 15 d of phosphorus treatment, samples were taken from leaves exposed to low-P (LLP), high-P (LHP), drought (LD), drought with low-P (LDLP), or drought with high-P (LDHP) conditions. All transcript levels were normalized to their respective corresponding levels in non-stressed control (LCK).
