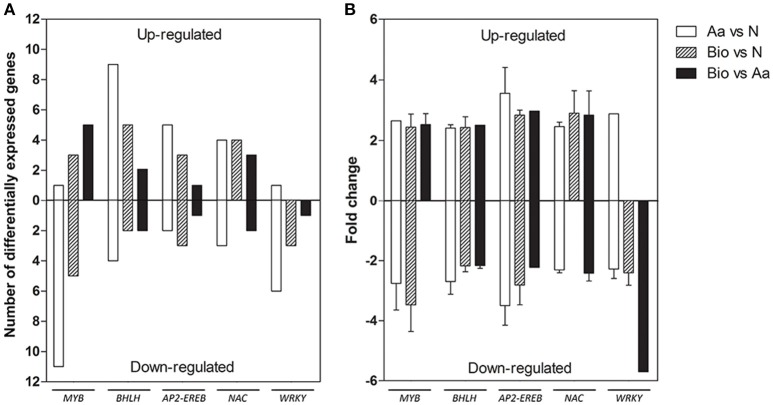
Figure 4.
Differentially expressed genes belonging to the most represented transcription factors families detected in the three comparisons, divided into up- and down-regulated. (A) Number of differentially expressed genes. (B) Expression fold change. The data reported are means of FC values ± SD calculated for each transcription family except for those transcription factor families comprising a single transcript.

