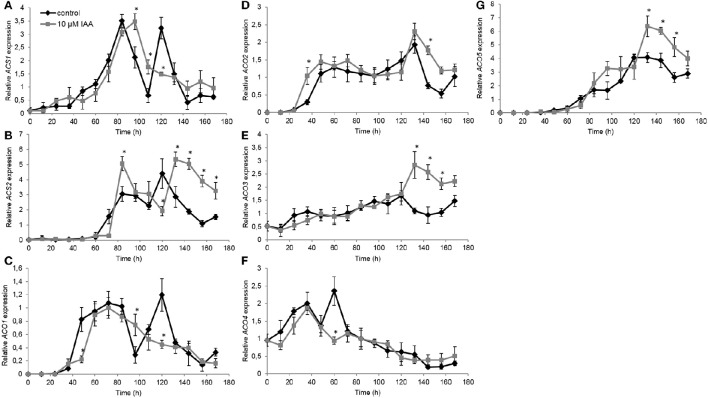
Figure 7.
Effect of indole-3-acetic acid (IAA) on the relative gene expression of ACS1 (A), ACS2 (B), ACO1 (C), ACO2 (D), ACO3 (E), ACO4 (F), and ACO5 (G) during seedling growth of sugar beet at 20°C in darkness. Mean values ± SD are presented (n = 3). The asterisk indicates that the IAA treatment differs significantly from the corresponding controls (p < 0.05).

