
FIGURE 3.
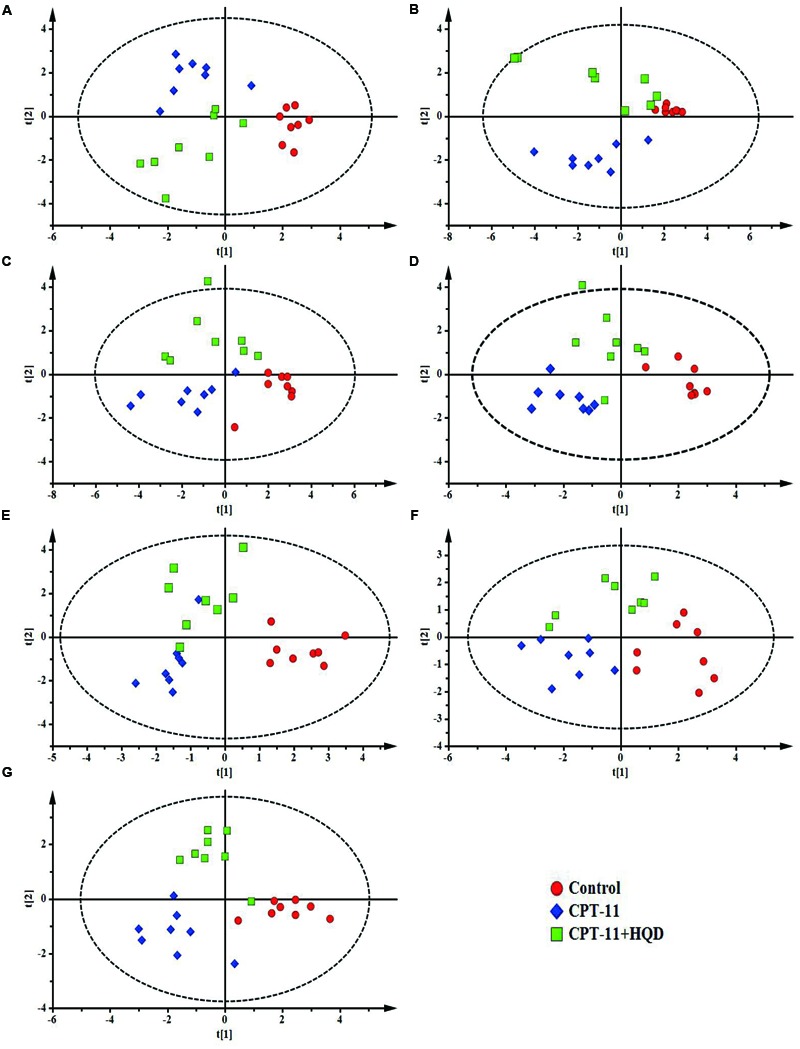
PLS-DA models of bile acids profiles. Based on the score plots, bile acids profiles of three groups of rats were shown for (A) serum, (B) liver, (C) jejunum, (D) ileum, (E) cecum, (F) colon, and (G) rectum. (A) R2X = 0.614, R2Y = 0.806, Q2 = 0.641; (B) R2X = 0.710, R2Y = 0.753, Q2 = 0.575; (C) R2X = 0.530, R2Y = 0.647, Q2 = 0.483; (D) R2X = 0.513, R2Y = 0.830, Q2 = 0.524; (E) R2X = 0.471, R2Y = 0.709, Q2 = 0.547; (F) R2X = 0.614, R2Y = 0.753, Q2 = 0.540; (G) R2X = 0.711, R2Y = 0.875, Q2 = 0.612.