
FIGURE 5.
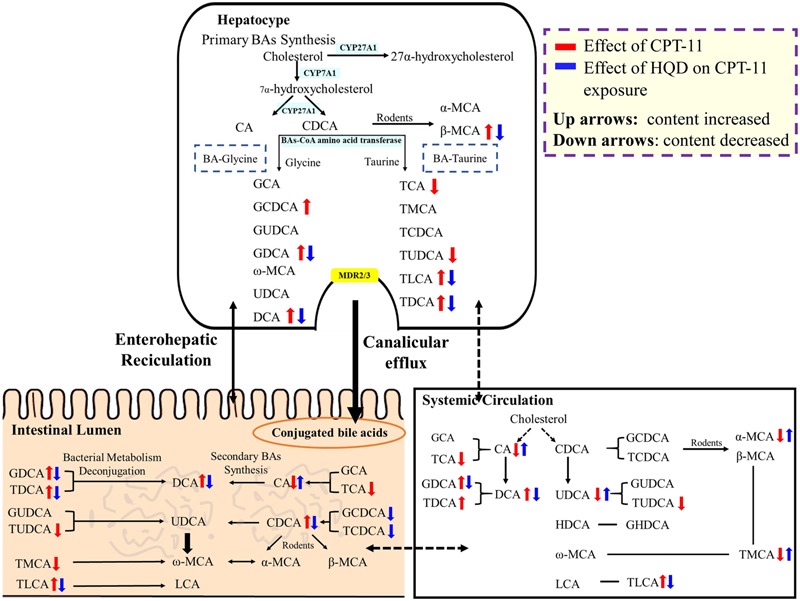
The impact of CPT-11 and HQD on bile acids metabolome. The bile acids profile in the intestine shows the combined data from five segments (jejunum, ileum, cecum, colon, and rectum). Bile acids with arrow is significantly changed (↑ content increased; ↓ content decreased).