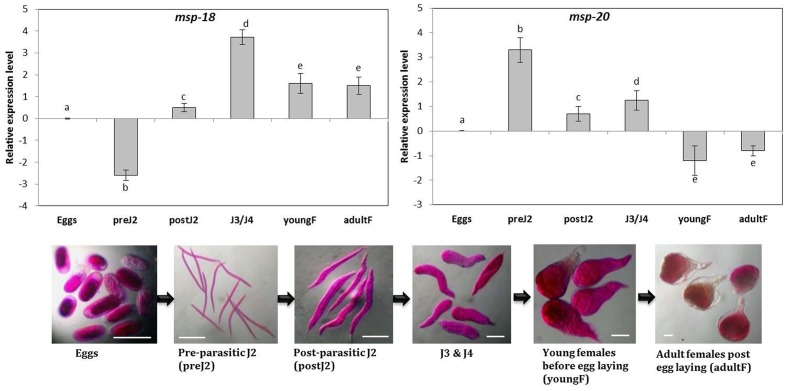
FIGURE 1.
Relative transcript abundance of msp-18 and msp-20 genes in different developmental stages of Meloidogyne incognita. Using the transcript level in eggs as reference, candidate genes (expression level was quantified by 2-ΔΔCt method) were significantly upregulated or downregulated or unaltered in different life stages. Each bar represents the log2-transformed mean of quantitative reverse-transcription PCR (qRT-PCR) runs in triplicate with standard errors. Letters indicate significant differences using Tukey’s HSD test (P < 0.05). Scale bar = 100 μm.

