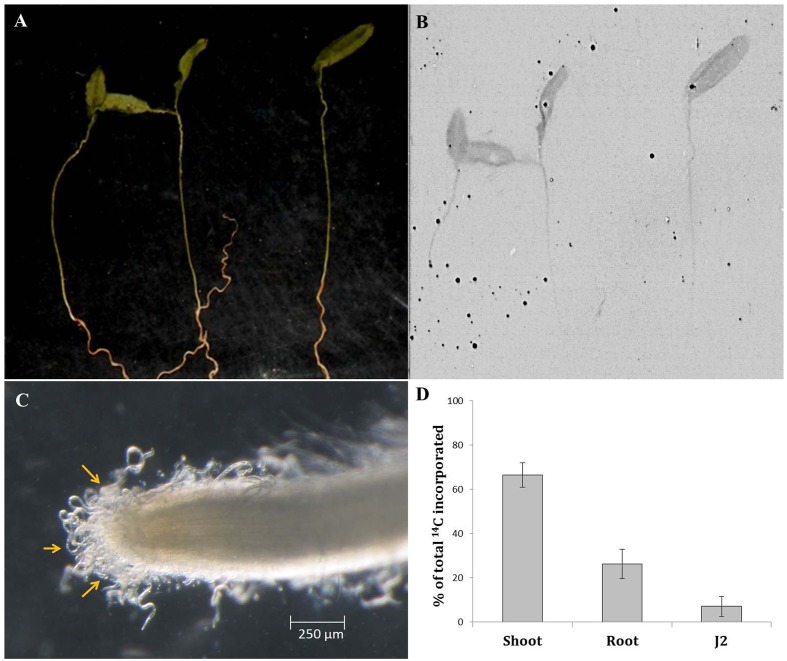
FIGURE 7.
Qualitative and quantitative representation of carbon transport from source to sink tissues. Picture (A) and autoradiogram (B) of 7-day-old eggplants (cv. Pusa Purple Long) labeled with 14CO2. Plants were labeled for 30 min in an airtight chamber followed by a chase period of 2 h in air. Dried plant material was exposed to the film for 7 days. (C) Infective M. incognita J2s latching on to the root tip of a labeled plant at 8 h post inoculation. One hundred J2s were inoculated behind the root tip in pluronic gel medium. (D) Relative 14C assimilation in shoot, root, and penetrating J2. The sum of the label is set to 100%. Mean ± SE (n = 12). Liquid scintillation counts (as dpm) of unlabelled plant material and freshly hatched J2s were used as the control.

