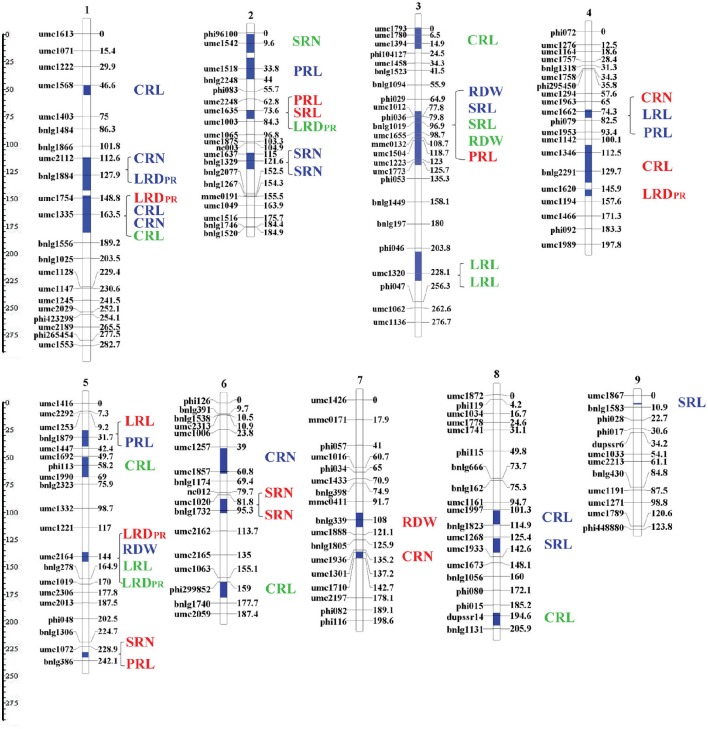
Figure 5.
Location of the QTL clusters detected for all investigated traits as revealed by meta-QTL analysis. QTL clustering determined by MetaQTL software as described by Veyrieras et al. (2007). The vertical blue lines in chromosomes represent the maker interval where QTLs were located. Each boxplot represents the identified QTL cluster, within which the QTL name was presented on the right. QTLs identified from paper roll, hydroponics and vermiculite were marked by red, blue and green letters, respectively.

