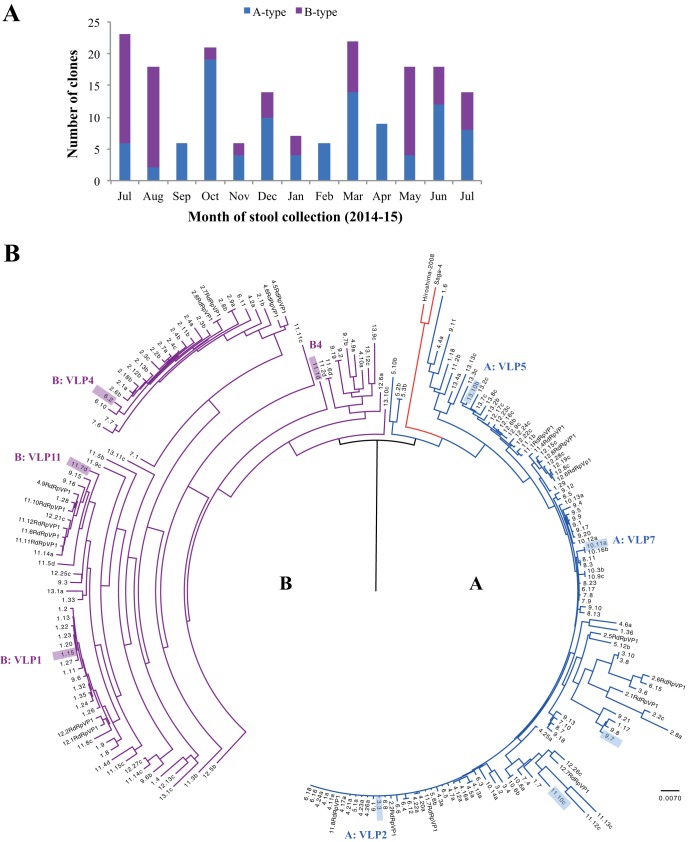
FIG 1 .
Analysis of isolated norovirus capsid quasi-sequences (labeled month.clone, e.g., 4.21a refers to month 4 and clone 21a). (A) Distribution of the type A and B capsid sequences. The numbers of capsid clones sequenced in each month were 23 (month 1), 18 (month 2), 6 (month 3), 21 (month 4), 6 (month 5), 14 (month 6), 7 (month 7), 6 (month 8), 22 (month 9), 9 (month 10), 19 (month 11), 18 (month 12), and 14 (month 13). (B) Nucleotide capsid sequences (182 capsid clones and 22 capsids from RdRp-VP1) with the gaps removed were aligned using ClustalW. The sequences were divided into types A (blue) and B (purple), along with reference sequences from Saga-4 (GenBank AB447457) and Hiroshima-2008 (GenBank AB541252). The scale bar represents the number of nucleotide substitutions per position. VLPs were produced for types A (VLP2, VLP5, and VLP7: clones 3.3, 13.10b, and 10.11a, respectively) and B (VLP1, VLP4, and VLP11: clones 1.15, 6.2, and 11.7d, respectively). See Fig. 5A and B for P domain homology models for sequences of type A (sequences 3.3, 9.7, 11.10c, and 13.10 b [shaded blue]) and type B (sequences 1.15, 6.2, 11.7d, and 11.1d [shaded purple]).

