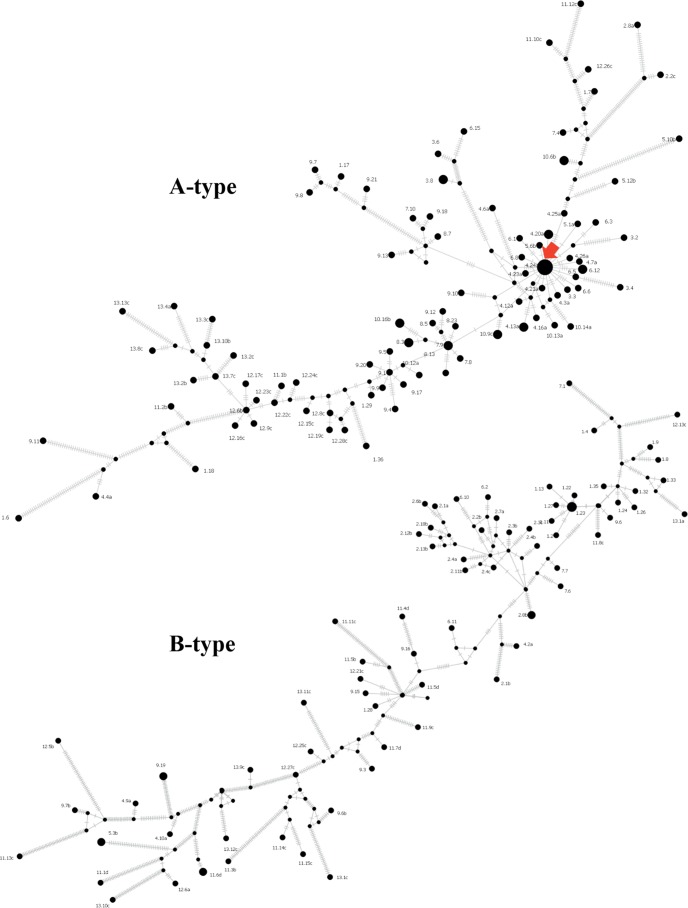
FIG 2 .
Median-joining haplotype network of 104 type A (top) and 78 type B (bottom) full-length capsid nucleotide sequences. Terminal circles represent sampled haplotypes with sizes proportional to the number of sequences. Haplotypes are labeled by the time in months since the collection of the first sample, followed by the clone number. Internal black dots indicate unsampled hypothetical haplotypes. The red arrow indicates a highly connected haplotype. Each hashed line denotes the number of nucleotide difference between the connected haplotypes. Connecting lines are not drawn to scale.

