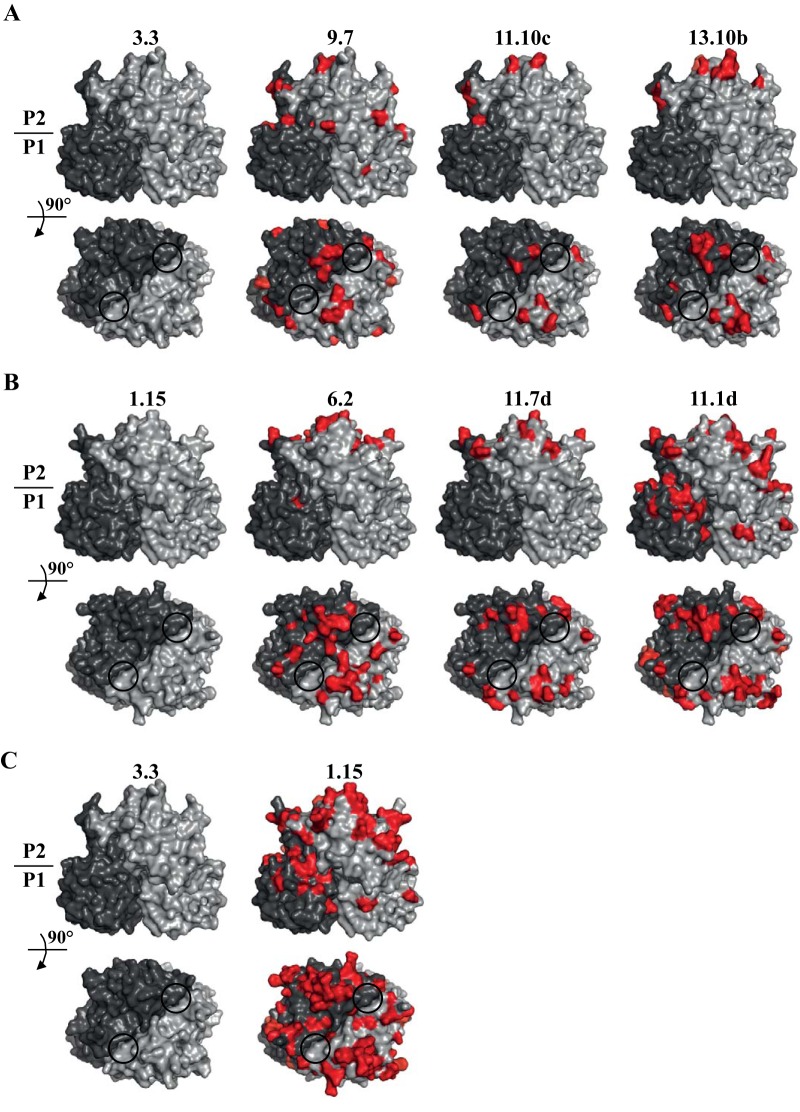
FIG 5 .
Amino acid substitutions on the P domains. (A and B) P domain homology models were created for different clusters (see Fig 1A and 2) in type A (sequences 3.3, 9.7, 11.10c, and 13.10 b) (A) and type B (sequences 1.15, 6.2, 11.7d, and 11.1d) (B). These variant sequences represent different branches based on the phylogenetic analysis (see Fig. 1B). The different grays represent each monomer, red shows the amino acid substitutions, and the black circles indicate the HBGA binding pockets. (C) Amino acid differences between type A (sequence 3.3) and type B (sequence 1.15). Substantial variations were observed throughout the P domain, whereas the region below the HBGA pocket remained relatively unchanged.

