
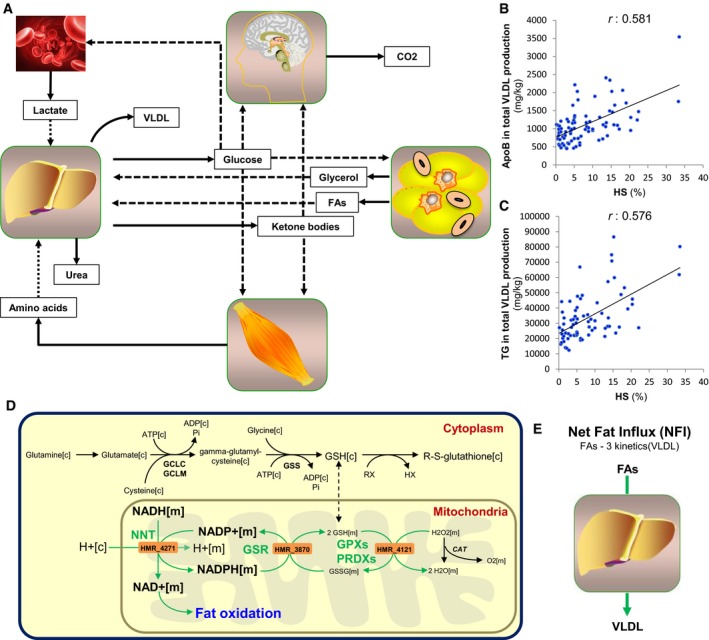
Figure 2. Personalized modeling of liver in subjects with varying degrees of HS .
-
ASchematic illustration of how personalized genome‐scale metabolic modeling can be performed accounting the interactions between other tissues and red blood cells for the development of effective therapeutic approaches for non‐alcoholic fatty liver disease (NAFLD). Solid and dashed arrows show the outputs and inputs to the tissues, respectively.
-
B, CThe correlation between the predicted intracellular fluxes of the liver and hepatic steatosis (HS) is assessed and compared with the (B) apolipoprotein B (apoB) and (C) triglycerides (TG) content in the total VLDL production.
-
DThe fluxes carried by the reactions catalyzed by NNT, GSR, and GPXs are found to be the most correlated reactions with the HS (Dataset EV3). Green arrow indicates the significant correlation of the flux carried by the reactions and HS.
-
EThe net fat influx (NFI) is calculated as the differences in the uptake and secretion rates of FAs and its correlation with the intracellular fluxes are assessed.