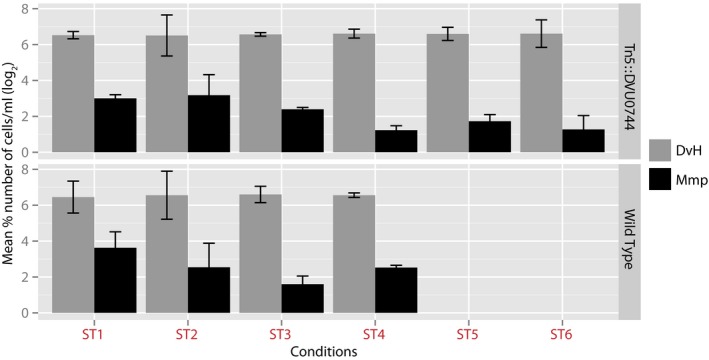
Figure EV1. Flow cytometry counts of Dv and Mm cells across all replicates and across multiple ST conditions.

Cell concentrations were calculated by dividing the number of events counted for each cell population by the volume sampled and reported as cell number per ml. Error bars correspond to standard deviation across 3 replicate measurements.
