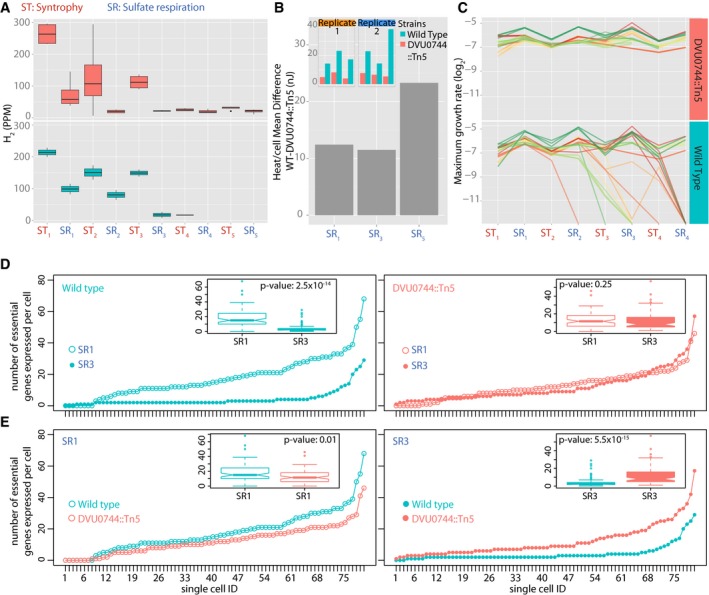
Boxplots for H2 levels in replicate wild‐type (lower panel) and mutant (upper panel) co‐cultures.
Microcalorimetry measurement of heat released (nj) per cell upon transition of wild‐type and mutant co‐cultures into SR conditions. Inset plots report total heat released by wild‐type (green) and mutant (red) co‐cultures in SR1, SR3, and SR5 conditions, in two replicate experiments. Gray bar plots represent difference between average heat production per cell of wild‐type and mutant strains, across the three successive SR conditions.
Growth rates for > 24 replicate co‐cultures of Mm with either wild‐type Dv (lower panel) or DVU0744::Tn5 (upper panel).
Significantly fewer essential genes are expressed across most single cells of the wild‐type population that is unable to grow in the subsequent transition. Here, the number of essential genes expressed above background genomic DNA are plotted for each analyzed single cell and cells are ordered by rank abundance for WT SR1‐ initial transfer versus SR3 transfer prior to collapse (left); and mutant SR1‐ initial transfer versus SR3 where growth continues in contrast to the WT population (right). Insets are boxplots of the same data with P‐values calculated from the equivalent of Mann–Whitney test (n = 80 single cells).
Number of essential genes per cell in wild type is compared to mutant during SR1 (left) and SR3 (right). See
Materials and Methods. Insets are boxplots of the same data with
P‐values calculated from the equivalent of Mann–Whitney test (
n = 80 single cells).
Data information: (A, D and E) The lower and upper ends of the boxes (“hinges”) correspond to the first and third quartiles (the 25
th and 75
th percentiles). Horizontal lines correspond to median values. Error bars extend from the upper or lower hinges to the highest or lowest values that are within 1.5× IQR (interquartile range) of the hinge, respectively. (D and E) The notches extend to ±1.58 IQR/sqrt.
Source data are available online for this figure.

