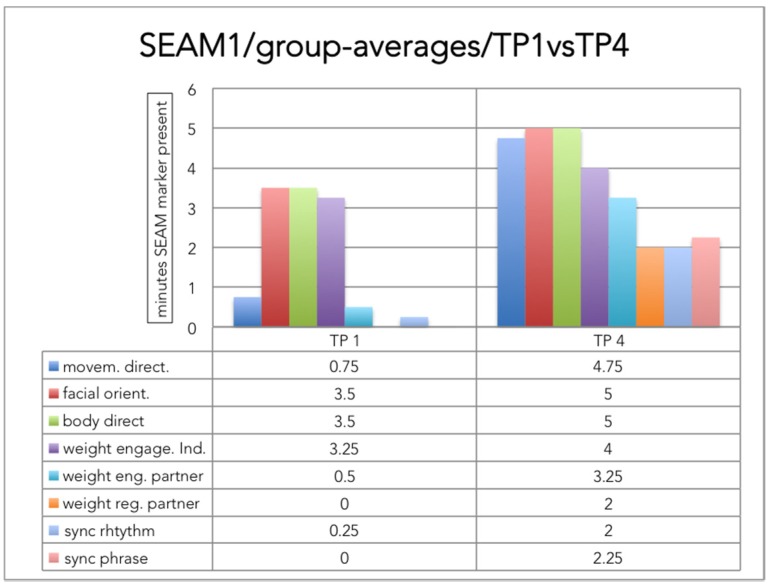
Figure 1.
To show a graphical summary of differences in the average group SEAM profile between the start and end of dance movement therapy (DMT). The SEAM categories are presented in columns; the height of the columns indicates the average number of minutes that a SEAM behavior was present during the observed five minutes’ samples.

