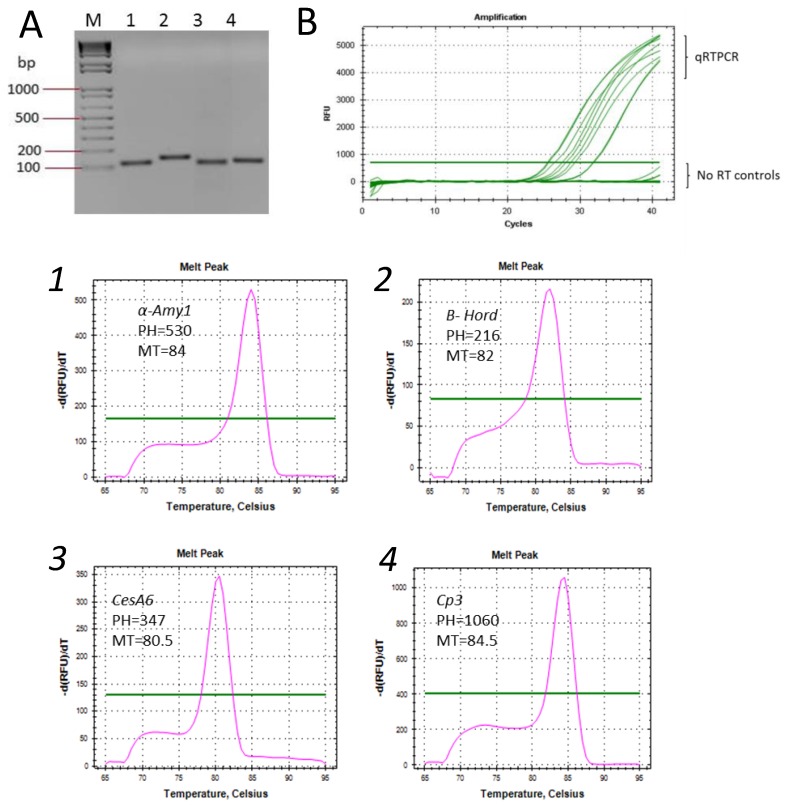
Figure 3.
Reverse transcription PCR (RT-PCR) and quantitative real-time PCR (qRT-PCR) assays. (A) an agarose gel; and (B) Ct values showing PCR amplification of four gene fragments from cDNA synthesized from RNA extracted by the modified Li and Trick [11] method and no reverse transcriptase (RT) controls. Lanes, (M): 100 bp marker; (1) α-amy1; (2) B-hord; (3) CesA6; (4) Cp3; and qRT-PCR melt curves of the above genes (corresponding numbers). PH: peak height; MT: melting temperature; green horizontal lines indicate threshold levels.

