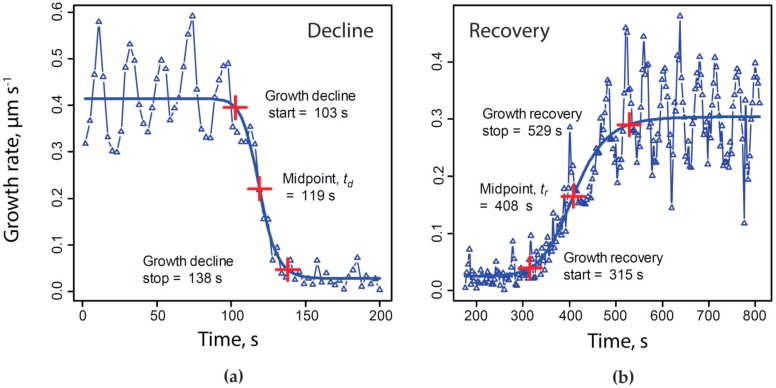
Figure 1.
Growth response to potassium cyanide (KCN) inhibition and time base normalization—determination of a normalized time base for each experiment, based upon growth rate patterns. Four parameter logistic curves were fitted to the decline (a) and recovery (b) of growth caused by transient exposure to and removal of 200 µM KCN. The times corresponding to each frame of each time-lapse sequence were first offset to set the midpoint of growth decline (Figure 1a, td) to zero, and then were divided by the span of growth inhibition, tr − td. Time points corresponding to 5 and 95 percent of growth (or other measurements) range were also recorded and averaged as an estimate of the initial time, duration and completion of each phase of the response to KCN.

