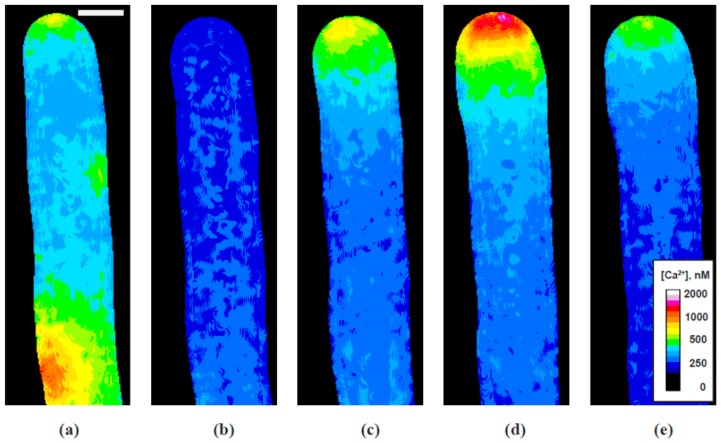
Figure 4.
[Ca2+]; Individual frames from a representative time-lapse video illustrating significant spatial distributions of [Ca2+] in a pollen tube transiently exposed to 200 µM KCN: (a) calcium “spark” shortly after KCN administration and the start of growth decline; (b) minimum cytoplasmic [Ca2+] throughout the cell, corresponding with minimum growth rate; (c) initial establishment of the tip Ca2+ gradient even while growth remains minimal; (d) re-established active Ca2+ gradient during oscillatory growth, showing tip maximum [Ca2+]; (e) re-established active Ca2+ gradient during oscillatory growth, showing [Ca2+] at the tip. Bar in (a) corresponds to 10 µm.

