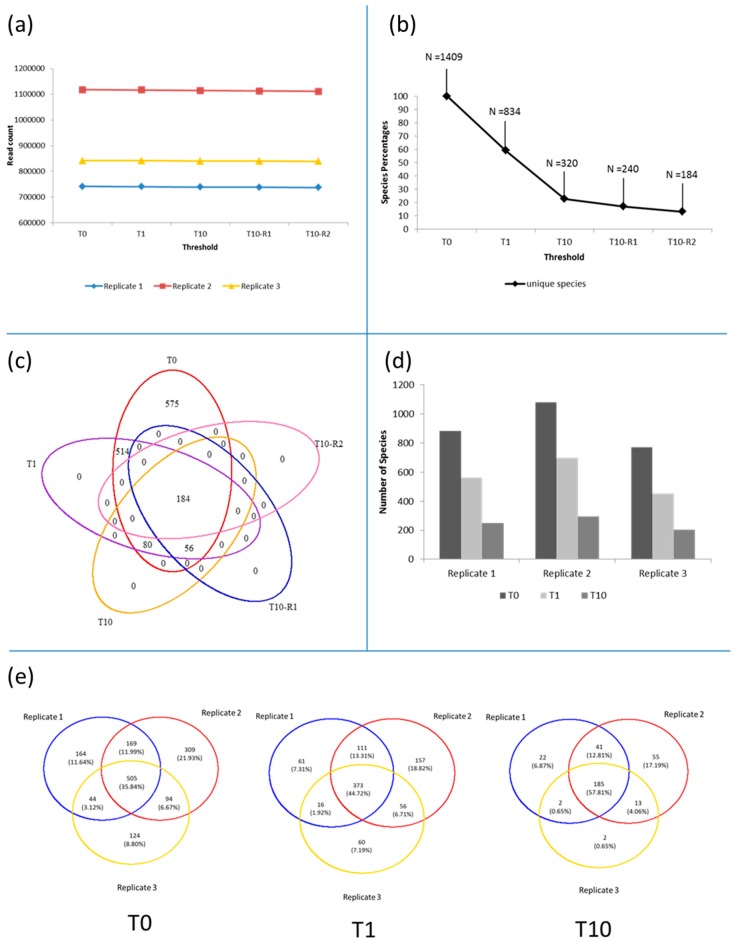
Figure 2.
Analyses of the prokaryotic fraction. (a) Reduction in number of reads when filters are applied; (b) percentage and phylotype count when filter are applied; (c) presence–absence analyses at phylotype level before and after application of the filters; (d) number of phylotype analyses by replicate; (e) presence–absence analyses at phylotype level when filters are applied to each replicate.

