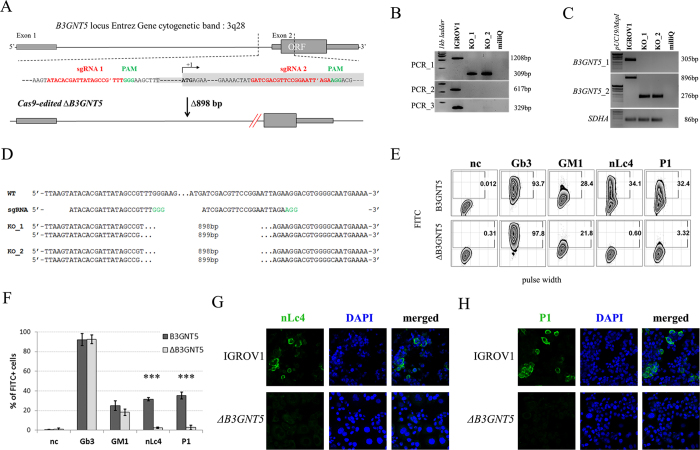
Figure 2. Deletion of B3GNT5 leads to depletion of nLc4 and P1.
(A) B3GNT5-editing strategy using two different sgRNAs (red) contain PAM sequence (green) deleting a genomic region up- and downstream of the transcription start site (+1) including a part of the open reading frame (ORF). In silico analysis revealed a deletion of 898 bp. (B) Representative genotyping PCR for characterization of single cell clones. PCR numbers indicate the use of different primer pairs listed in experimental procedures. (C) Semi-quantitative PCR with two different primer pairs (B3GNT5_1 and B3GNT5_2) on wildtype (pIGROV1) and two representative knockout clones. SDHA was used as a reference gene. (D) DNA sequencing results for wildtype (WT), and selected biallelically deleted knockout clones (KO_1 and KO_2). (E) Representative counter plots for presence of Gb3, GM1, nLc4 and P1 before (wildtype B3GNT5) and after gene disruption of B3GNT5 in IGROV1 cells (∆B3GNT5). Percentage of GSL-positive cells (FITC) is shown in each plot. Negative control (n.c.). (F) Box and Whisker plots representing CRISPR Cas9-mediated changes in expression of individual GSLs (percentage of FITC-positive cells, ordinate) for ∆B3GNT5 and parental cells (abscissa). ***p < 0.001 was obtained by two-way ANOVA. Data are representative out of four independent experiments. (G,H) Confocal fluorescence images displaying presence and absence of nLc4 (green, G, 40x magnification) and P1 (green, H) in B3GNT5 wildtype (B3GNT5) and knockout (∆B3GNT5) cells, respectively. Cells are counterstained with DAPI (blue). Data are represented as mean ± s.d.

