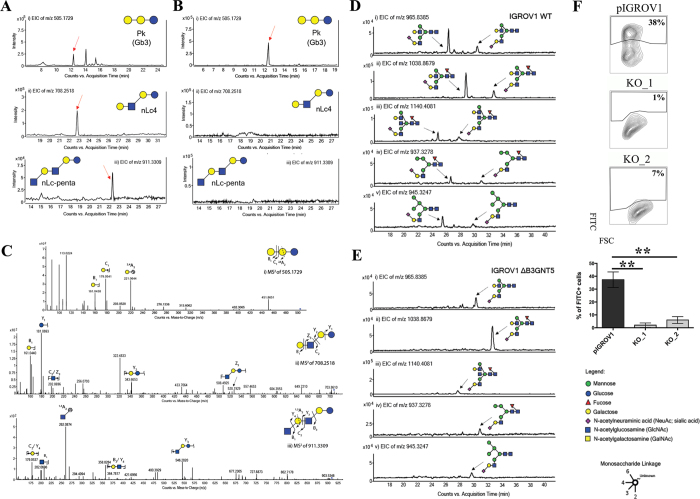
Figure 3. LC-MS profiling of neutral GSLs and monosialylated N-glycans extracted from wildtype IGROV1 and genome-edited B3GNT5 cell lines.
The extracted ion chromatograms (EIC) obtained from wildtype IGROV1 (A) and genome-edited B3GNT5 (B) cell lines are represented for Gb3 [m/z 505.17291−Galα1-4Galβ1-4Glcβ1] (i), nLc4 [m/z 708.25181−:Galβ1-4GlcNAcβ1-3Galβ1-4Glcβ1] (ii) and nLc-pentasaccharide [m/z 911.33091−:GlcNAcβ1-3-Galβ1-4GlcNAcβ1-3Galβ1-4Glcβ1] (iii). (C) MS2 spectrum of the precursor ion at m/z 505.17291−, m/z 708.25181− and m/z 911.33091− derived from Gb3 (i), nLc4 (ii) and nLc-penta (iii), respectively. PGC- LC allows for the separation of α2-6 and α2-3 sialylated N-glycans based on retention time. (D) The EICs obtained from the wildtype IGROV 1 depict three major monosialylated complex N-glycans at m/z 965.83852− [(Neu5Ac)1(Gal)2(GlcNAc)2+ (Man)3(GlcNAc)2] (i), m/z 1038.86792− [(Neu5Ac)1 (Gal)2(GlcNAc)2(Fuc)1+ (Man)3(GlcNAc)2] (ii) and m/z 1140.40812− [(Neu5Ac)1(Gal)2 (GlcNAc)3(Fuc)1 + (Man)3(GlcNAc)2] (iii) and two monosialylated hybrid N-glycans at m/z 937.32782− [(Neu5Ac)1(Gal)1(GlcNAc)1(Man)1 + (Man)3(GlcNAc)2] (iv) and m/z 945.32472− [(Neu5Ac)1(Gal)1(GlcNAc)1(Man)2 + (Man)3(GlcNAc)2] (v) which display α2–3 and α2–6 sialylated isomers at separate retention times. (E) The EICs of genome-edited B3GNT5 cells depicts the loss of the α2–6 sialylated isomer for all five of the above mentioned monosialylated complex [m/z 965.83852− (i), m/z 1038.86792−(ii), m/z 1140.40812− (iii)] and hybrid [m/z 937.32782− (iv), m/z 945.32472− (v)] N-glycans. (F) SNA staining confirmed reduction of α2–6 sialylation in ∆B3GNT5 cells. Representative counter plot and barograph summarizing three independent experiments on parental IGROV1 cells (pIGROV1) and ∆B3GNT5 cells (KO_1 and KO_2); **p-value < 0.01. Data are represented as mean ± s.d.

