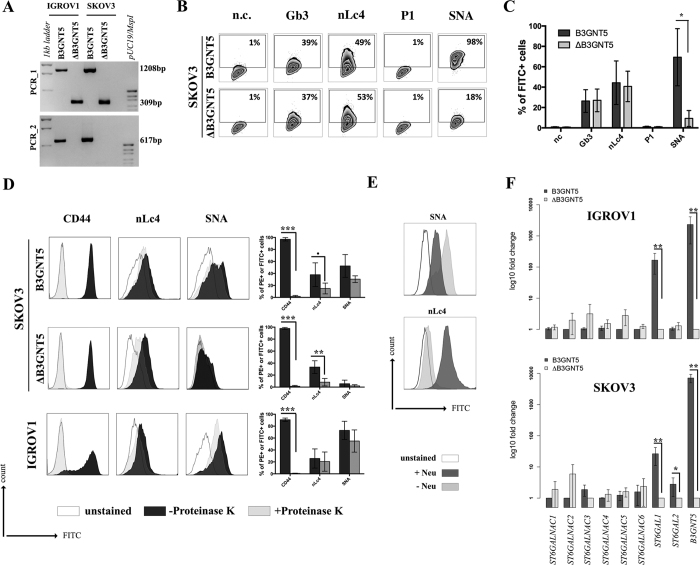
Figure 5. The reduction of α2-6 sialylation occurs in two ∆B3GNT5 ovarian cancer cell lines.
(A) Representative genotyping PCR for ∆B3GNT5 SKOV3 ovarian cancer cells. PCR_1, wildtype-specific PCR; PCR_2, deletion specific PCR. (B) Representative zebra plot for GSL expression in SKOV3 wildtype and ∆B3GNT5 cells. (C) Quantified data from three independent flow cytometry experiments. (D) The epitope for anti-nLc4 antibodies is present on glycoproteins and glycosphingolipids in SKOV3 and IGROV1 cells, respectively. Proteinase K treatment on SKOV3, SKOV3 ∆B3GNT5 and IGROV1 cells following staining for CD44, nLc4 and α2-6 neuraminic acid (with SNA). Representative histogram for unstained (white), proteinase K untreated (dark gray) and proteinase K treated cells (light gray). Bar chart summarizes three independent experiments. ***p < 0.001, **p < 0.01, *p-value < 0.05,p-value < 0.1. (E) Histogram for IGROV1 cells treated with neuraminidase and stained for α2-6 neuraminic acid (with SNA) and nLc4; unstained (white), neuraminidase treated (dark gray) and untreated cells (light gray). (F) Relative expression of genes encoding glycosyltransferase known to attach α2-6 neuraminic acid to glycoproteins and glycosphingolipids. Bar chart shows the mean and standard deviation of three independent experiments of target genes (ST6GALNAC1-6, ST6GAL1, ST6GAL2, and B3GNT5) in wildtype (IGROV1 and SKOV3) and corresponding ∆B3GNT5 cells. Data are represented as mean ± s.d.

