Table 1. Proposed GSL-glycan structures detected on the glycolipid membranes of ovarian cancer cells, IGROV1 (wildtype) and ∆B3GNT5 cells.
| Type | No | Glycan Mass [M-H]- | Glycan Structures | PGC-ESI-QTOF-MS/MS |
PGC-ESI-IT-MS/MS | |
|---|---|---|---|---|---|---|
| IGROV1 | B3GNT5-edited IGROV1 | P1-enriched IGROV1 (Anugraham M, et al, 2015) | ||||
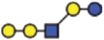
| Neutral GSL | 1 | 505.2 (Pk) |

|
6.34 ± 0.31 | 4.72 ± 2.38 | 0.00 |
| 2 | 546.3 |

|
0.00 | 0.00 | 0.00 | |
| 3a | 708.3 (Globo) |

|
0.00 | 0.00 | 0.00 | |
| 3b | 708.3 (Asialo-GM1) |

|
0.00 | 0.00 | 0.00 | |
| 3c | 708.3 (Neo-lacto) |
|
4.52 ± 1.58 | 0.00 | 7.64 | |
| 4 | 870.3 (P1) |
|
0.00 | 0.00 | 2.43 | |
| 5 | 911.3 |
|
1.25 ± 0.48 | 0.00 | Trace | |
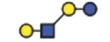
| Sialylated GSL | 6 | 634.2 (GM3) |

|
14.18 ± 0.61 | 23.40 ± 4.32 | 12.86 |
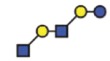
| 7 | 837.3 (GM2) |

|
73.71 ± 2.40 | 71.88 ± 8.13 | 73.11 | |
| 8a | 999.3 (GM1) |

|
0.00 | 0.00 | 0.68 | |
| 8b | 999.3 (α2-3 sialyl Paragloboside) |

|
0.00 | 0.00 | 2.15 | |
| 8c | 999.3 (LSTc) |

|
0.00 | 0.00 | 1.14 | |
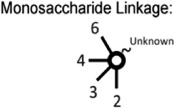
Structures were assigned based on MS/MS fragmentation (where possible) and known biological GSL synthetic pathway constraints. All structures were depicted according to the CFG (Consortium of Functional Glycomics) notation with linkage placement. Specific linkages corresponding to Gal-GlcNAc (Type 1/Type 2) lactosamine linkages are also indicated (where possible). Values represent mean relative ion intensities ± s.d. of three replicates based on their extracted ion chromatograms (EIC). GSL-glycan structures derived from P1-enriched IGROV1 cell line previously analyzed with PGC-ESI-IT-MS (20) are also shown for comparative profiling using two different MS platforms. Gb3 (Pk).
 Glucose
  Galactose
  N-acetylglucosamine (GlcNAc)
  N-acetylgalactosamine (GalNAc)
  N-acetylneruaminic acid (NeuAc)