
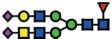
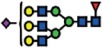
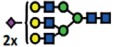
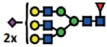
Table 2. Proposed N- and O-glycan structures detected on the membrane proteins of IGROV1 (wildtype) and ∆B3GNT5 cells.
| Type | No | Glycan Mass [M-H]− | [M-2H]2− | Glycan Structures | PGC-ESI-QTOF-MS/MS |
PGC-ESI-IT-MS/MS | |
|---|---|---|---|---|---|---|---|
| IGROV1 | B3GNT5-edited IGROV1 | IGROV1 (Anugraham M, et al, 2014) | |||||
| N -glycans -High Mannose | 1 | 1235.4 | 617.2 |

|
4.15 ± 0.11 | 5.54 ± 0.16 | 0.62 ± 0.06 |
| 2 | 1397.6 | 698.3 |

|
5.31 ± 0.24 | 4.88 ± 0.64 | 7.91 ± 0.15 | |
| 3 | 1559.6 | 779.3 |

|
9.13 ± 0.27 | 9.48 ± 1.21 | 13.45 ± 1.35 | |
| 4 | 1721.6 | 860.3 |

|
19.19 ± 1.15 | 20.85 ± 1.57 | 16.00 ± 3.73 | |
| 5 | 1883.8 | 941.4 |

|
23.48 ± 2.02 | 22.29 ± 0.79 | 24.57 ± 6.02 | |
| 6 | 2045.6 | 1022.3 |

|
1.88 ± 0.21 | 1.73 ± 0.52 | 1.43 ± 0.61 | |
| N -glycans -Hybrid | 7 | 1567.6 | 783.3 |

|
0.00 | 0.00 | 0.19 ± 0.03 |
| 8 | 1584.6 | 791.8 |

|
0.00 | 0.00 | 0.34 ± 0.11 | |
| 9 | 1600.6 | 799.8 |

|
0.63 ± 0.01 | 0.83 ± 0.12 | 1.04 ± 0.30 | |
| 10 | 1713.6 | 856.3 |

|
0.00 | 0.00 | 1.76 ± 0.21 | |
| 11 | 1729.6 | 864.3 |

|
0.00 | 0.00 | 0.68 ± 0.20 | |
| 12 | 1746.6 | 872.8 |

|
0.00 | 0.00 | 0.20 ± 0.00 | |
| 13a | 1875.6 | 937.3 (α2-6) |

|
0.65 ± 0.03 | 0.00 | 0.20 ± 0.25 | |
| 13b | 1875.6 | 937.3 (α2-3) |

|
0.42 ± 0.05 | 0.74 ± 0.07 | 0.41 ± 0.20 | |
| 14a | 1891.6 | 945.3 (α2-6) |

|
1.34 ± 0.09 | 0.00 | 0.47 ± 0.22 | |
| 14b | 1891.6 | 945.3 (α2-3) |

|
0.67 ± 0.05 | 1.33 ± 0.17 | 0.43 ± 0.08 | |
| N -glycans -Complex Neutral Hybrid | 15 | 1463.6 | 731.2 |

|
1.25 ± 0.20 | 1.36 ± 0.35 | 0.74 ± 0.03 |
| 16 | 1625.6 | 812.3 |

|
0.00 | 0.14 ± 0.25 | 0.64 ± 0.14 | |
| 17 | 1641.6 | 820.3 |

|
0.62 ± 0.01 | 1.16 ± 0.18 | 1.59 ± 0.62 | |
| 18 | 1666.4 | 832.8 |

|
0.00 | 0.00 | 1.22 ± 0.40 | |
| 19 | 1682.6 | 840.8 |

|
0.00 | 0.00 | 0.12 ± 0.05 | |
| 20 | 1771.8 | 885.4 |

|
0.00 | 0.00 | 0.00 | |
| 21 | 1787.6 | 893.3 |

|
1.99 ± 0.05 | 3.48 ± 0.47 | 3.50 ± 0.22 | |
| 22 | 1812.8 | 905.9 |

|
0.00 | 0.00 | 0.24 ± 0.08 | |
| 23 | 1828.8 | 913.9 |

|
0.00 | 1.30 ± 0.34 | 0.66 ± 0.12 | |
| 24 | 1844.8 | 921.9 |

|
1.25 ± 0.06 | 2.01 ± 0.09 | 1.37 ± 0.19 | |
| 25 | 1869.8 | 934.4 |

|
0.00 | 0.19 ± 0.33 | 0.51 ± 0.20 | |
| 26 | 1933.6 | 966.3 |

|
1.23 ± 0.78 | 1.15 ± 0.13 | 0.00 | |
| 27 | 1974.8 | 986.9 |

|
0.18 ± 0.31 | 0.00 | 0.79 ± 0.28 | |
| 28 | 1990.8 | 994.9 |

|
6.29 ± 1.36 | 8.23 ± 0.73 | 2.62 ± 0.60 | |
| 29 | 2006.8 | 1002.9 |

|
1.84 ± 0.39 | 1.75 ± 0.61 | 0.31 ± 0.15 | |
| 30 | 2015.8 | 1007.4 |

|
0.00 | 0.00 | 0.14 ± 0.06 | |
| 31 | 2079.8 | 1039.4 |

|
0.00 | 0.00 | 0.00 | |
| 32 | 2120.8 | 1059.9 |

|
0.00 | 0.00 | 0.56 ± 0.19 | |
| 33 | 2136.6 | 1067.8 |

|
2.32 ± 0.27 | 3.44 ± 0.35 | 0.31 ± 0.15 | |
| 34 | 2152.8 | 1075.9 |
|
0.77 ± 0.40 | 1.47 ± 0.95 | 1.18 ± 0.16 | |
| 35 | 2162 | 1080.5 |

|
1.22 ± 0.22 | 0.25 ± 0.15 | 0.39 ± 0.09 | |
| 36 | 2356 | 1177.5 |
|
0.84 ± 0.07 | 1.13 ± 0.14 | 0.23 ± 0.02 | |
| 37 | 2518 | 1258.5 |

|
1.88 ± 0.24 | 1.20 ± 0.22 | 0.37 ± 0.10 | |
| N -glycans -Complex Sialylated Hybrid Complex Sialylated | 38 | 1916.6 | 957.8 |
|
0.00 | 0.00 | 0.21 ± 0.06 |
| 39a | 1932.8 | 965.9 (α2-6) |
|
1.41 ± 0.11 | 0.00 | 1.38 ± 0.38 | |
| 39b | 1932.8 | 965.9 (α2-3) |
|
0.86 ± 0.05 | 1.28 + 0.24 | 1.86 ± 0.49 | |
| 40a | 2078.8 | 1038.9 (α2-6) |
|
4.96 ± 0.35 | 0.00 | 1.91 ± 0.23 | |
| 40b | 2078.8 | 1038.9 (α2-3) |
|
1.68 ± 0.16 | 3.94 ± 0.27 | 3.23 ± 0.14 | |
| 41 | 2119.8 | 1059.4 |

|
0.00 | 0.00 | 0.36 ± 0.15 | |
| 42 | 2223.8 | 1111.4 |
|
0.00 | 0.00 | 0.41 ± 0.07 | |
| 43 | 2265.8 | 1132.4 |
|
0.00 | 0.00 | 0.06 ± 0.02 | |
| 44a | 2282.0 | 1140.5 (α2-6) |

|
1.35 ± 0.11 | 0.00 | 0.35 ± 0.14 | |
| 44b | 2282.0 | 1140.5 (α2-3) |
|
1.20 ± 0.34 | 2.30 ± 0.06 | 0.30 ± 0.17 | |
| 45 | 2297.8 | 1148.4 |
|
0.00 | 0.00 | 0.23 + 0.02 | |
| 46 | 2370.0 | 1184.5 |
|
0.00 | 0.00 | 1.33 ± 0.36 | |
| 47 | 2411.0 | 1205 |
|
0.00 | 0.00 | 0.06 ± 0.02 | |
| 48 | 2444.0 | 1221.5 |
|
1.30 + 0.46 | 0.00 | 0.65 ± 0.07 | |
| 49 | 2589.0 | 1294.0 |
|
0.00 | 0.00 | 0.03 ± 0.00 | |
| 50 | 2735.0 | 1367.0 |
|
0.00 | 0.00 | 0.03 ± 0.00 | |
| 51 | 3026.0 | 1512.5 |
|
0.00 | 0.00 | 0.19 ± 0.08 | |
| O-glycans | 1a | 675.3 | NA |

|
9.10 ± 2.32 | 13.08 ± 2.43 | NA |
| 1b | 675.3 | NA |

|
31.55 ± 4.19 | 27.59 ± 2.21 | NA | |
| 2 | 966.3 | NA |

|
52.11 ± 2.60 | 52.25 ± 0.59 | NA | |
| 3 | 749.3 | NA |

|
0.00 | 0.00 | NA | |
| 4 | 1040.5 | NA |

|
7.24 ± 1.26 | 7.08 ± 0.44 | NA | |
| 5 | 1331.5 | NA |

|
0.00 | 0.00 | NA | |
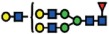
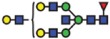
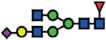
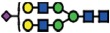
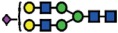
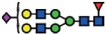
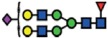
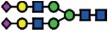
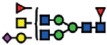
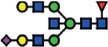
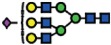
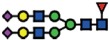
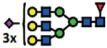
N- and O-glycan structures were separated by PGC-UHPLC-ESI-QTOF and their structures were assigned based on MS/MS fragmentation (where possible), retention time differences and biological pathway constraints. Structures were depicted according to the Consortium of Functional Glycomics (CFG) notation with linkages (α2, 3 and α2, 6) indicated for sialic acid (where known). Values represent mean relative ion intensities ± SD of three replicates based on their extracted ion chromatograms (EIC). N-glycan structures derived from IGROV1 cell line previously analyzed with PGC-ESI-IT-MS13,19 are also shown for comparative profiling using two different MS platforms.
 Galactose
  Mannose
  Fucose
  N-acetylglucosamine (GlcNAc)
  N-acetylgalactosamine(GalNAc)
  N-acetylneruaminic acid (NeuAc; sialic acid).