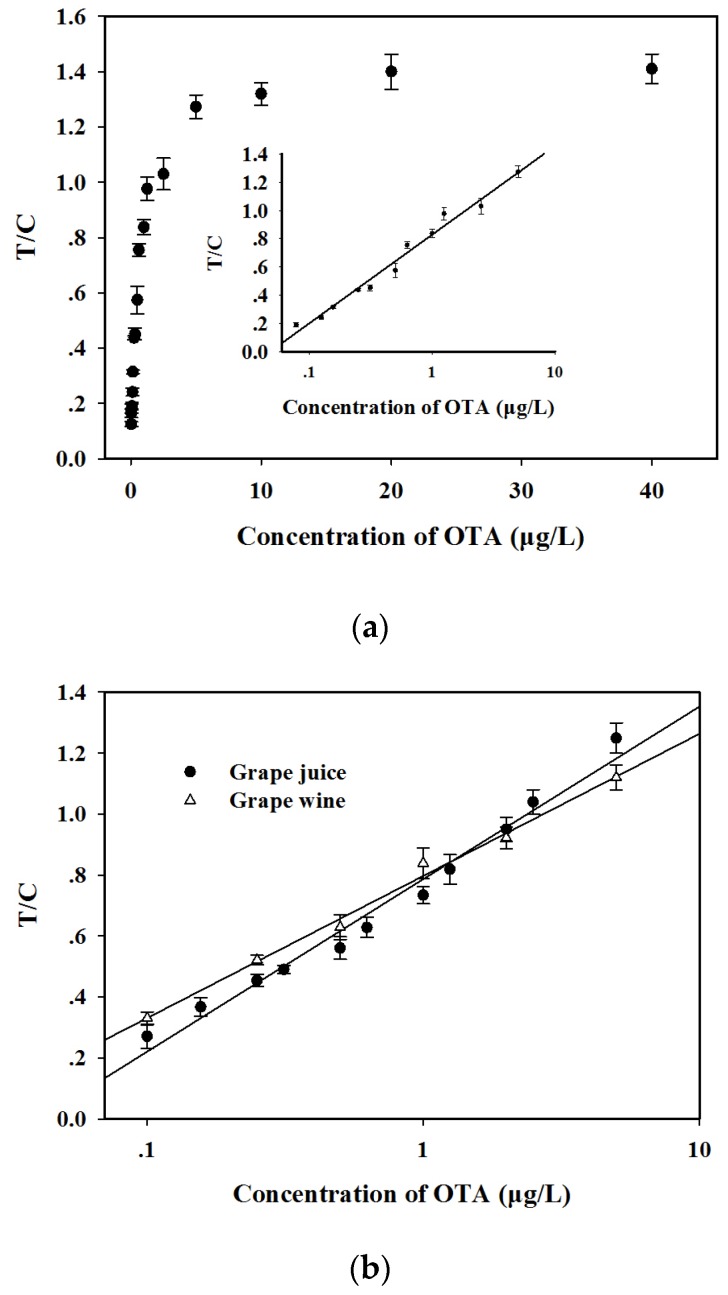
Figure 4.
(a) Standard curve for OTA quantitative analysis in phosphate buffer solution (0.01 M, pH 7.0). The regression equation is: y = 0.272 lnx + 0.828 (0.08 ≤ x ≤ 5.0 µg/L, R2 = 0.98); (b) Matrix-matched standard curves for OTA quantitative analysis in red grape wine and juice samples. The regression equations are: y = 0.245 lnx + 0.786 (0.10 ≤ x ≤ 5.0 µg/L, R2 = 0.98) for grape juice sample and y = 0.202 lnx + 0.797 (0.10 ≤ x ≤ 5.0 µg/L, R2 = 0.99) for red grape wine sample. The vertical bars indicate the standard deviation (n = 3).

