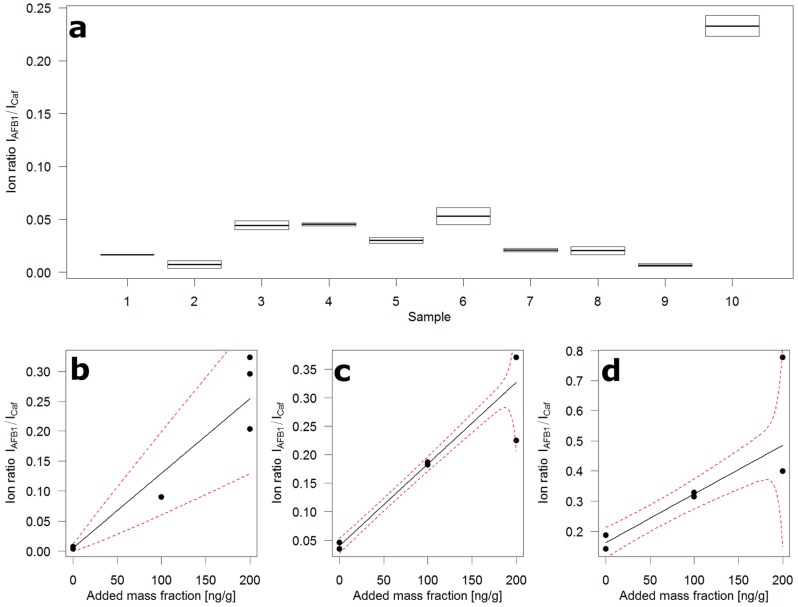
Figure 4.
Ion ratio distribution over ten 10 g samples of contaminated crushed maize and standard addition plots. (a) Box plot of duplicate flow injections of ten random sub-samples, boxes extend to the two measured ion ratios, horizontal line depicts the mean of the two ion ratios; (b) Standard addition plot of sample 2 in (a); (c) Standard addition plot of sample 6 in (a); (d) Standard addition plot of sample 10 in (a); black circles—ion ratio (mean of two injections), black line—regression fit, red broken line—prediction interval.

