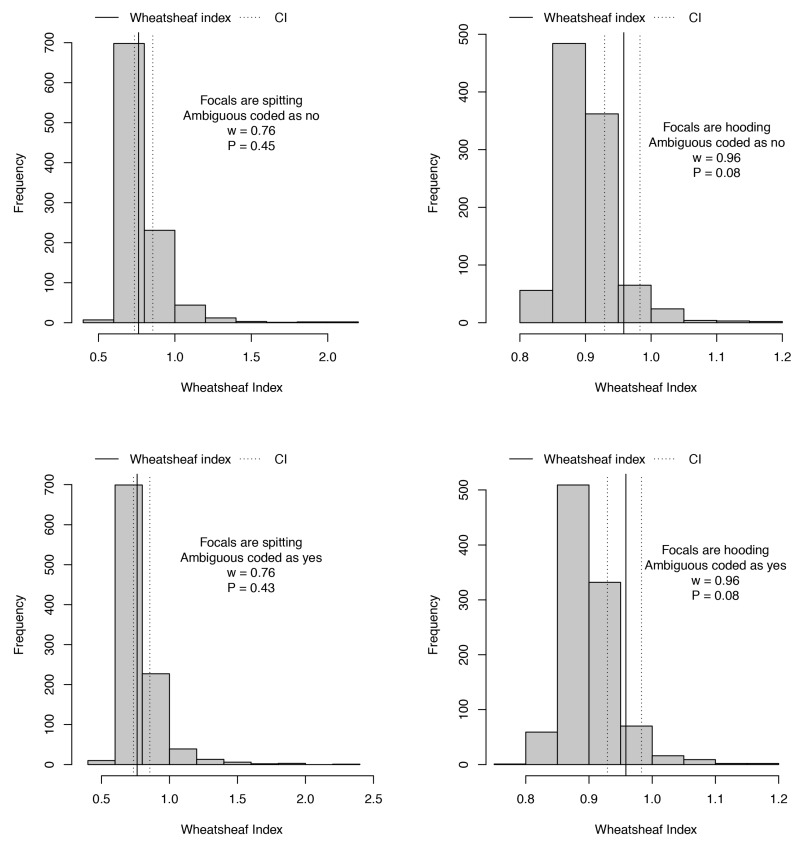
Figure 3.
Analyses of strength of convergence in cytotoxicity in association with spitting or hooding behaviour, under both coding schemes for ambiguous species. Histograms show that the null distribution represented expected strengths of convergence in each analysis, with solid and dotted lines overlaid to show calculated Wheatsheaf index (w) and its 95% confidence interval respectively. Wheatsheaf index is presented alongside the p-value for exceptionally strong convergence in each case. Note that alternative codings make a little difference to results but convergence in cytotoxicity is slightly stronger (with a higher Wheatsheaf index) when associated with hooding than spitting behaviour.

