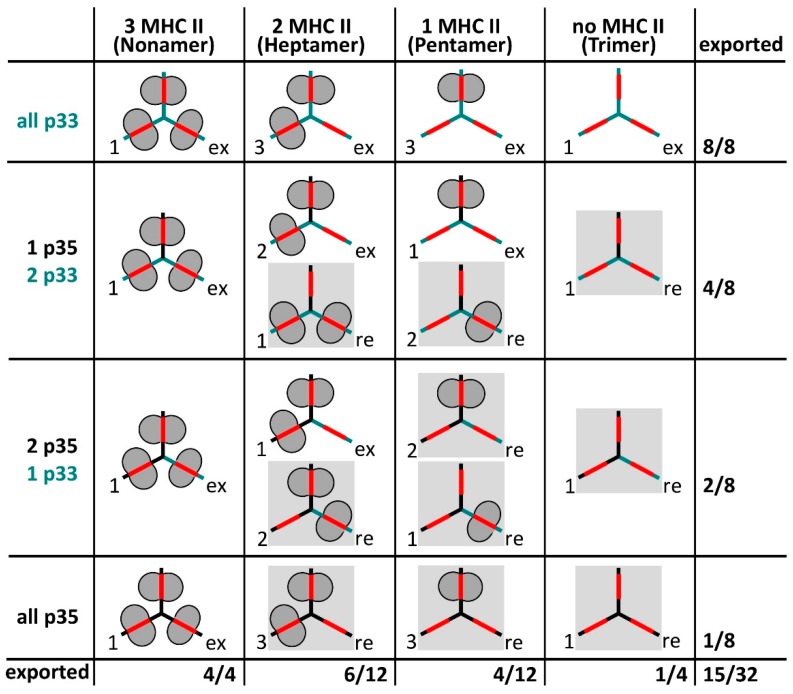
Figure 3.
Combination matrix for different association forms of Ii p33, Ii p35 and MHC II and their endoplasmic reticulum (ER) retention phenotype, based on results from Thibodeau and coworkers (see text). The number of different association forms in respect to MHC II binding is given to the left of each icon, the retention phenotype to the right (re = retained in the ER, ex = exported to endosomes and the cell surface). The fraction of exported association forms is given to the right and at the bottom of the matrix. Note that from a total of 32 association forms, 15 should be exported to endosomes and the cell surface.

