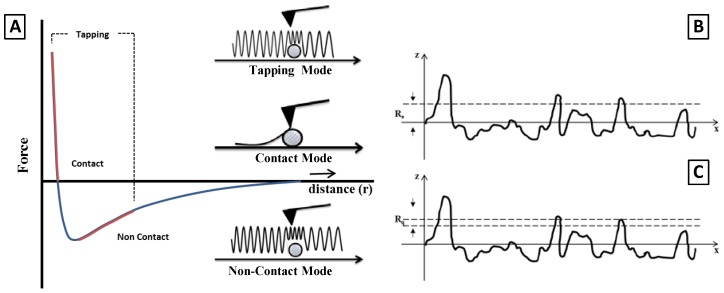
Figure 1.
(A) Tip-sample separation curve illustrating the main interaction during Atomic force microscopy (AFM) scanning. The AFM imaging modes for each regime are also shown. Graphical definition of (B) Average roughness and (C) Root Mean Square Roughness (RMS) Roughness ( ). This figure is freely inspired by [25].

